GammaBaba

Options Data Visualization
Tools & Analytics Platform

Real-time GEX heatmap, candlestick charts with gamma overlays, live option flow, market sentiment, 3D volatility surface, and multi-ticker compare — all in one platform for 6,000+ US stocks & ETFs.

Dashboard See All Features

Works with any optionable US ticker

SPYQQQAAPLTSLANVDAAMZNMETAMSFTAMDGOOGLNFLXJPMBACXOMSOFIPLTRIWMDIAGLDTLTCOINMARARDDTCRDO+ 6,000 more
✅ What we do

Visualize US equity options data as interactive heatmaps, charts, 3D surfaces, and comparison dashboards.

❌ What we don't

No financial advice · No trade execution · No brokerage connections · No trading signals. Data is for informational purposes only.

Explore the GEX landscape visually

Interactive visualization tools for exploring gamma exposure data across strikes and expirations.

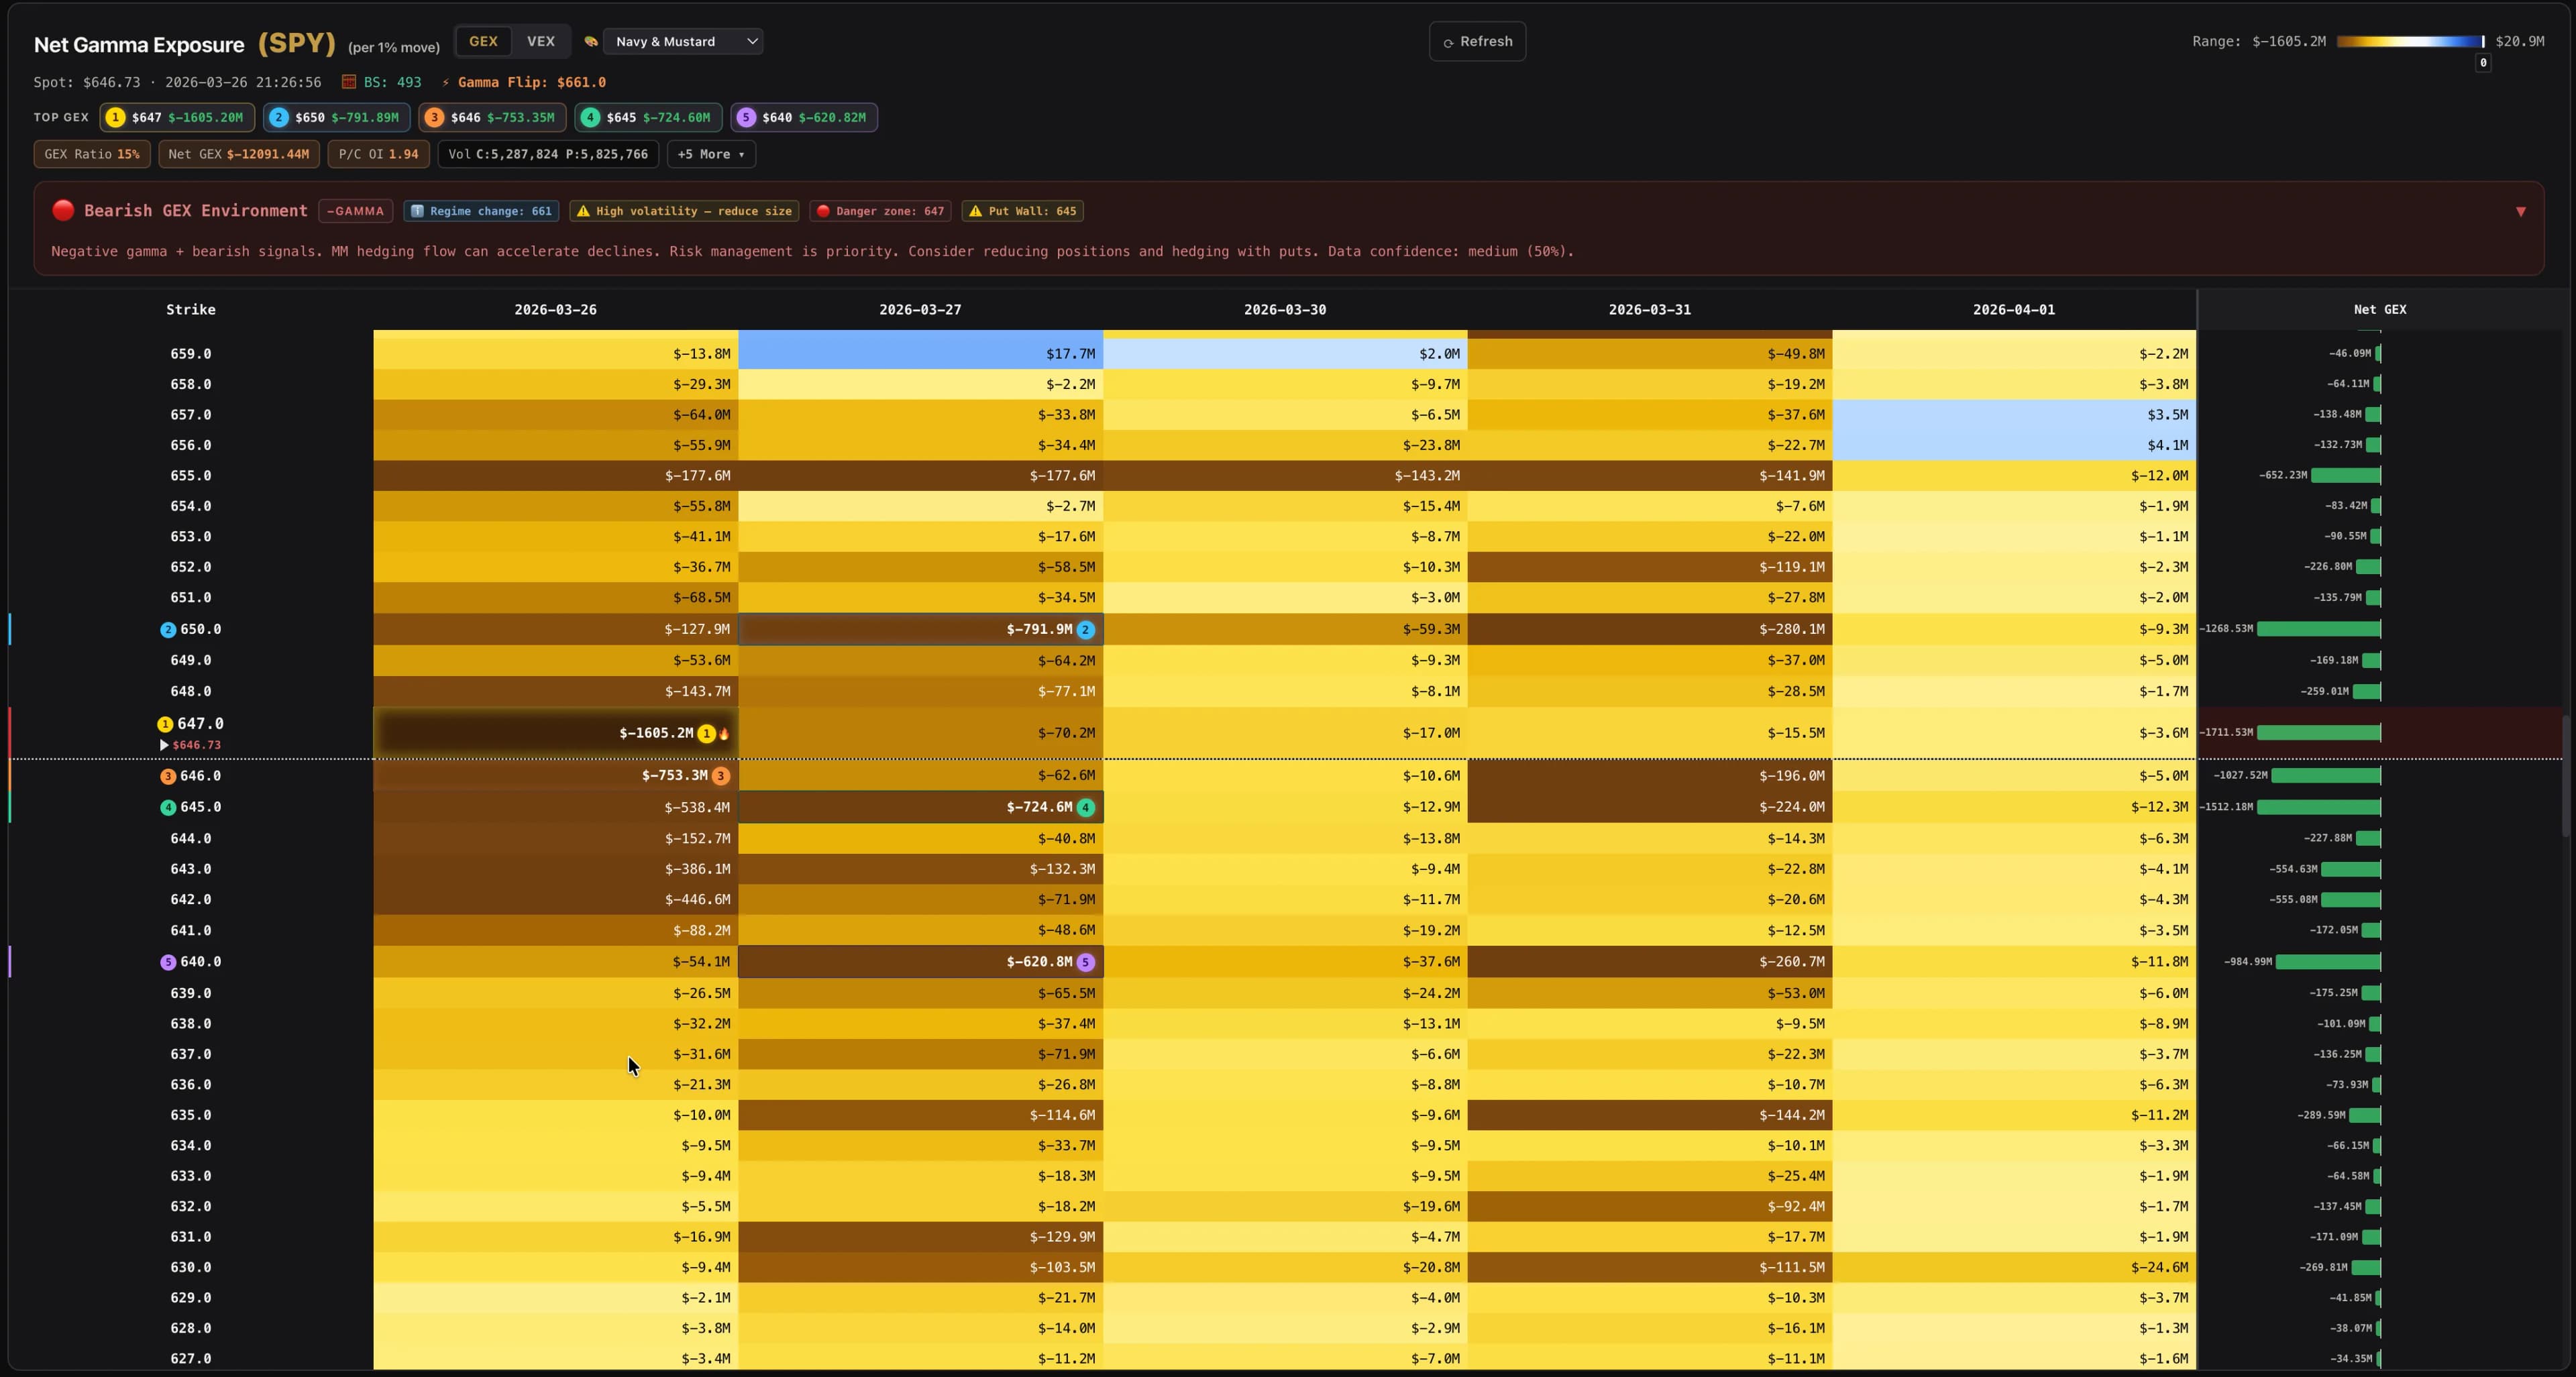
Interactive GEX Heatmap

Strike × expiration grid with color-coded gamma exposure. Blue call walls attract price, green put walls amplify moves. Click any cell for contract-level detail.

Top 5 Highest GEX Nodes

Instantly see the five highest-gamma strike levels for any ticker. Know which price nodes have the most gamma concentration and why they stand out.

Options Activity Feed

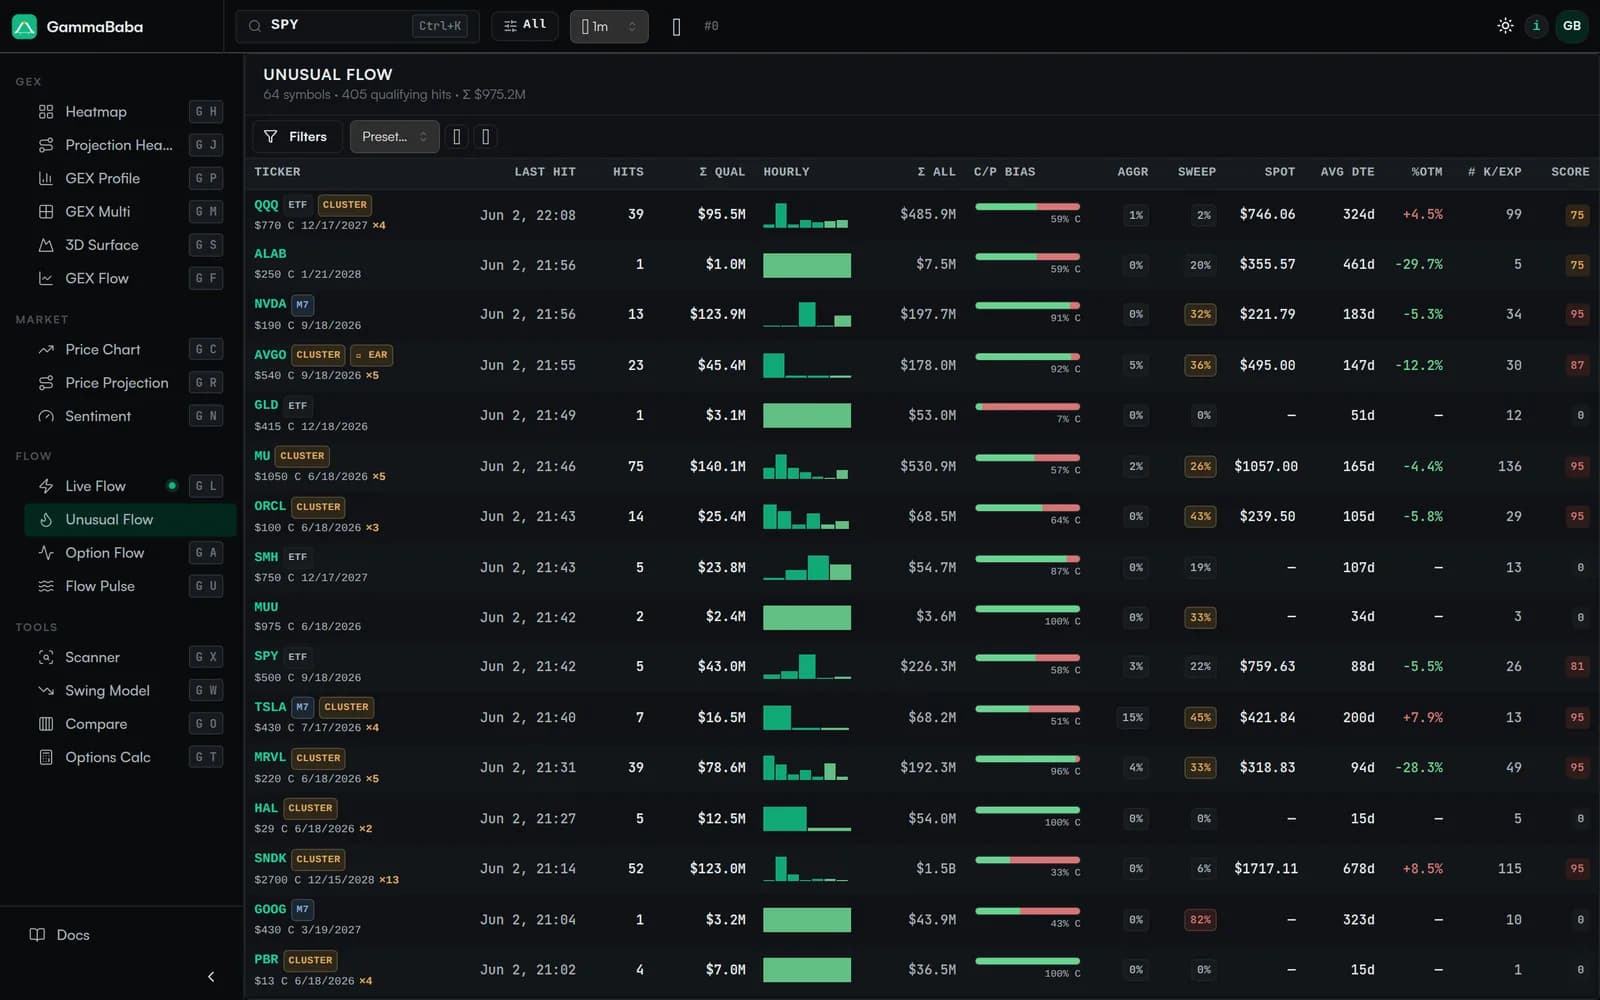
Real-time feed of unusual options activity filtered by size, premium, and sentiment. See large orders as they appear — not hours later.

Real-Time Auto-Refresh

GEX data updates automatically during market hours. Choose your refresh interval — from 1 minute to 4 hours — and watch how gamma positioning shifts intraday.

Watchlist & Sidebar

Track multiple tickers in a collapsible sidebar. Switch between them instantly without losing your current view settings or refresh state.

Black-Scholes Estimation

Built-in options pricing model for any strike. Estimate theoretical value, delta, gamma, and IV side-by-side with live market data for comparison.

How it works

From ticker to full visualization in four steps.

1

Enter a Ticker

Type any US stock or ETF symbol — SPY, AAPL, TSLA, and 6,000+ supported tickers.

2

View the Heatmap

The GEX heatmap loads instantly, showing gamma exposure across all strikes and expirations.

3

Find the Top Node

The top 5 highest GEX nodes are ranked automatically — see where gamma concentration is highest.

4

Track Changes

Enable auto-refresh and compare snapshots over time to watch gamma positioning evolve intraday.

Options Trading 101 — An Old Wolf's Stories
Free Book

Options Trading 101 — An Old Wolf's Stories

A storyteller's guide to options trading — risk, the Greeks, core strategies, and the discipline it takes to survive. Free to read online; PDF and EPUB available with a free account.

Six visualization tools, one platform

Each tool is built around the same options data, so every view shows the same dataset from a different angle.

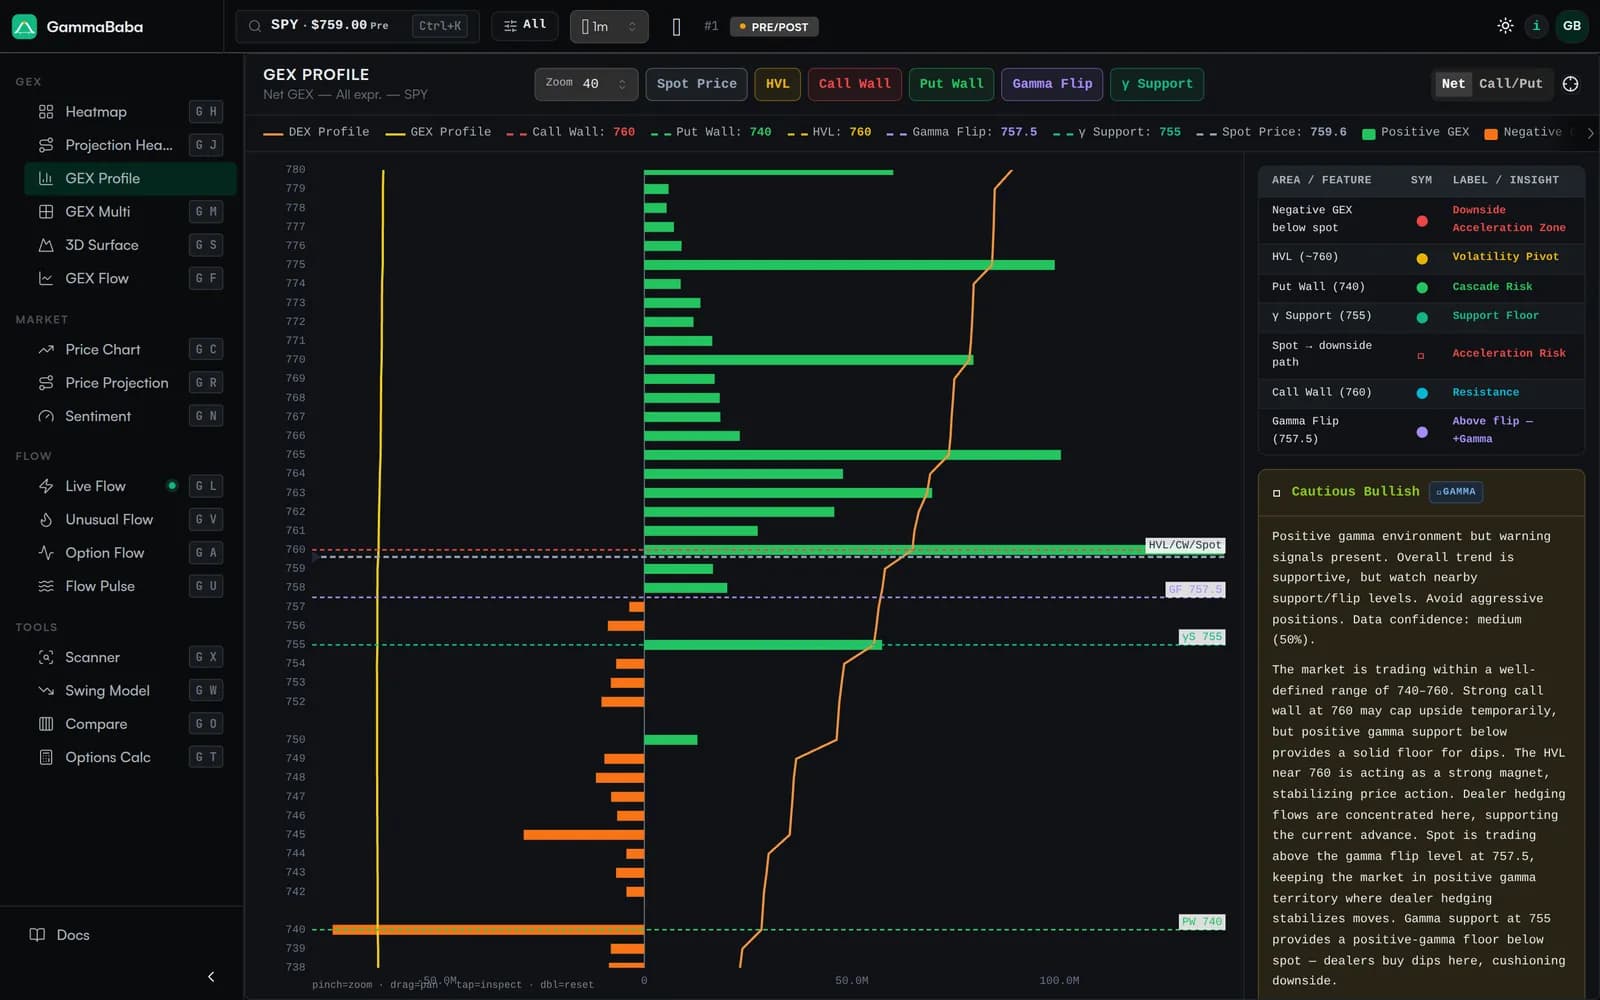
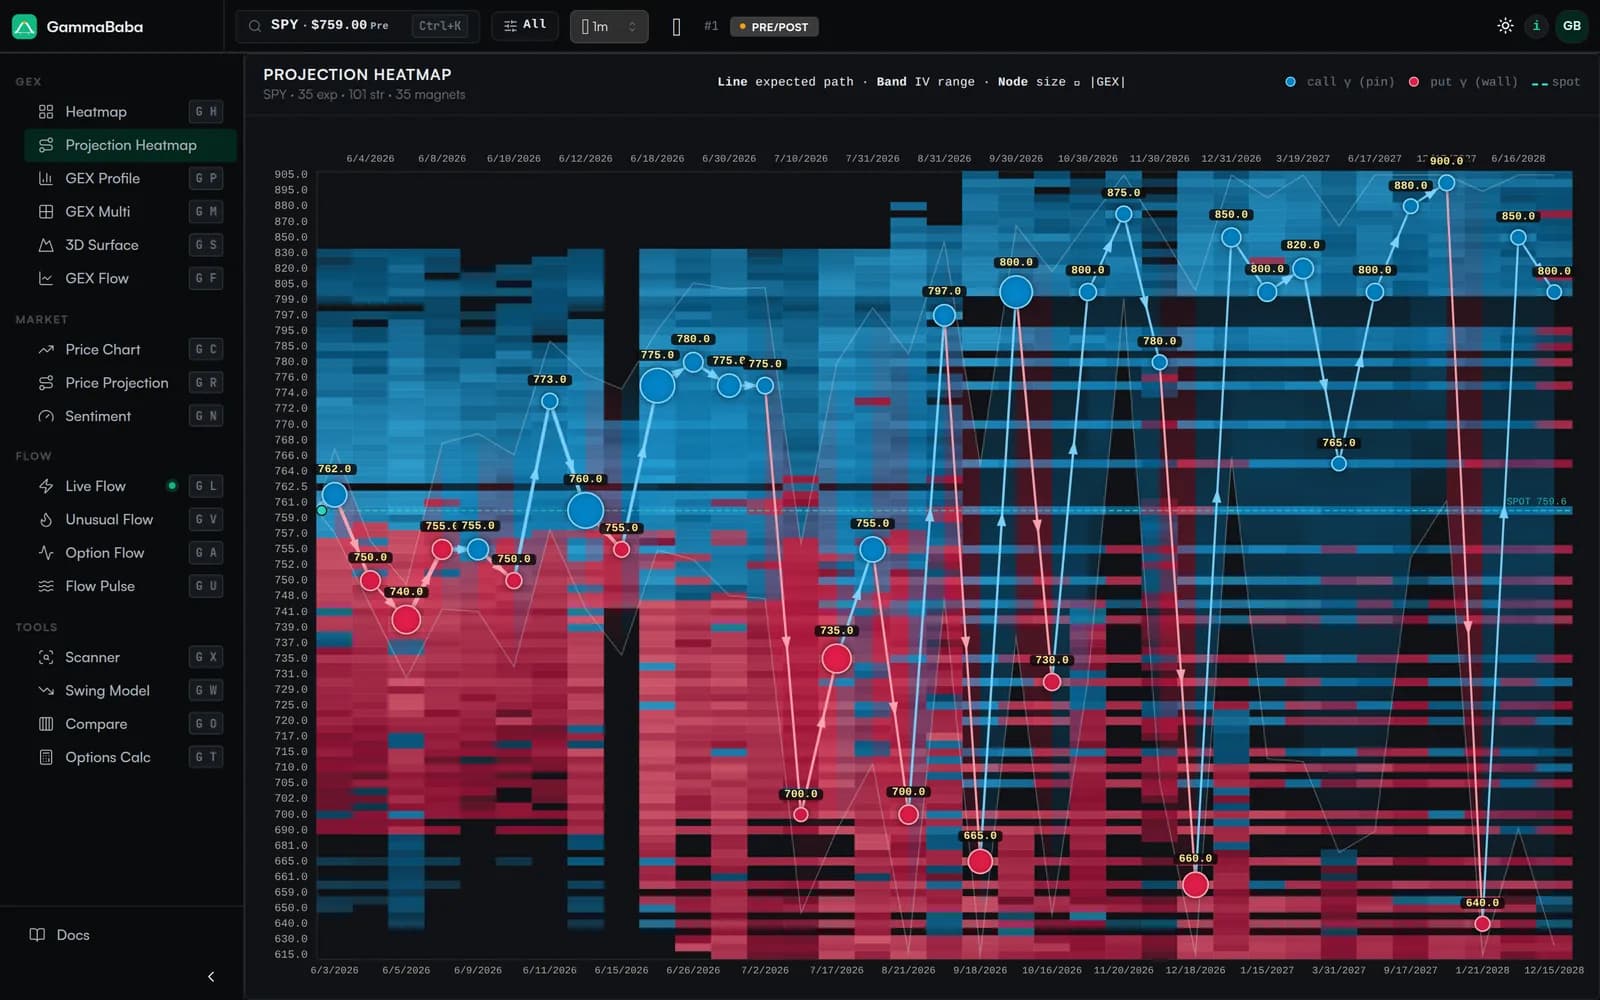
GEX Heatmap

Gamma Exposure by Strike & Expiration

Strike × expiration grid with color-coded gamma exposure. Blue cells highlight call-wall concentrations, green cells mark put-wall zones. Click any cell for contract-level detail and time-shifted comparison.

  • King Strike detection
  • 1m → 4h time comparison
  • VEX overlay
  • Auto-refresh
Open GEX Heatmap
GEX Heatmap
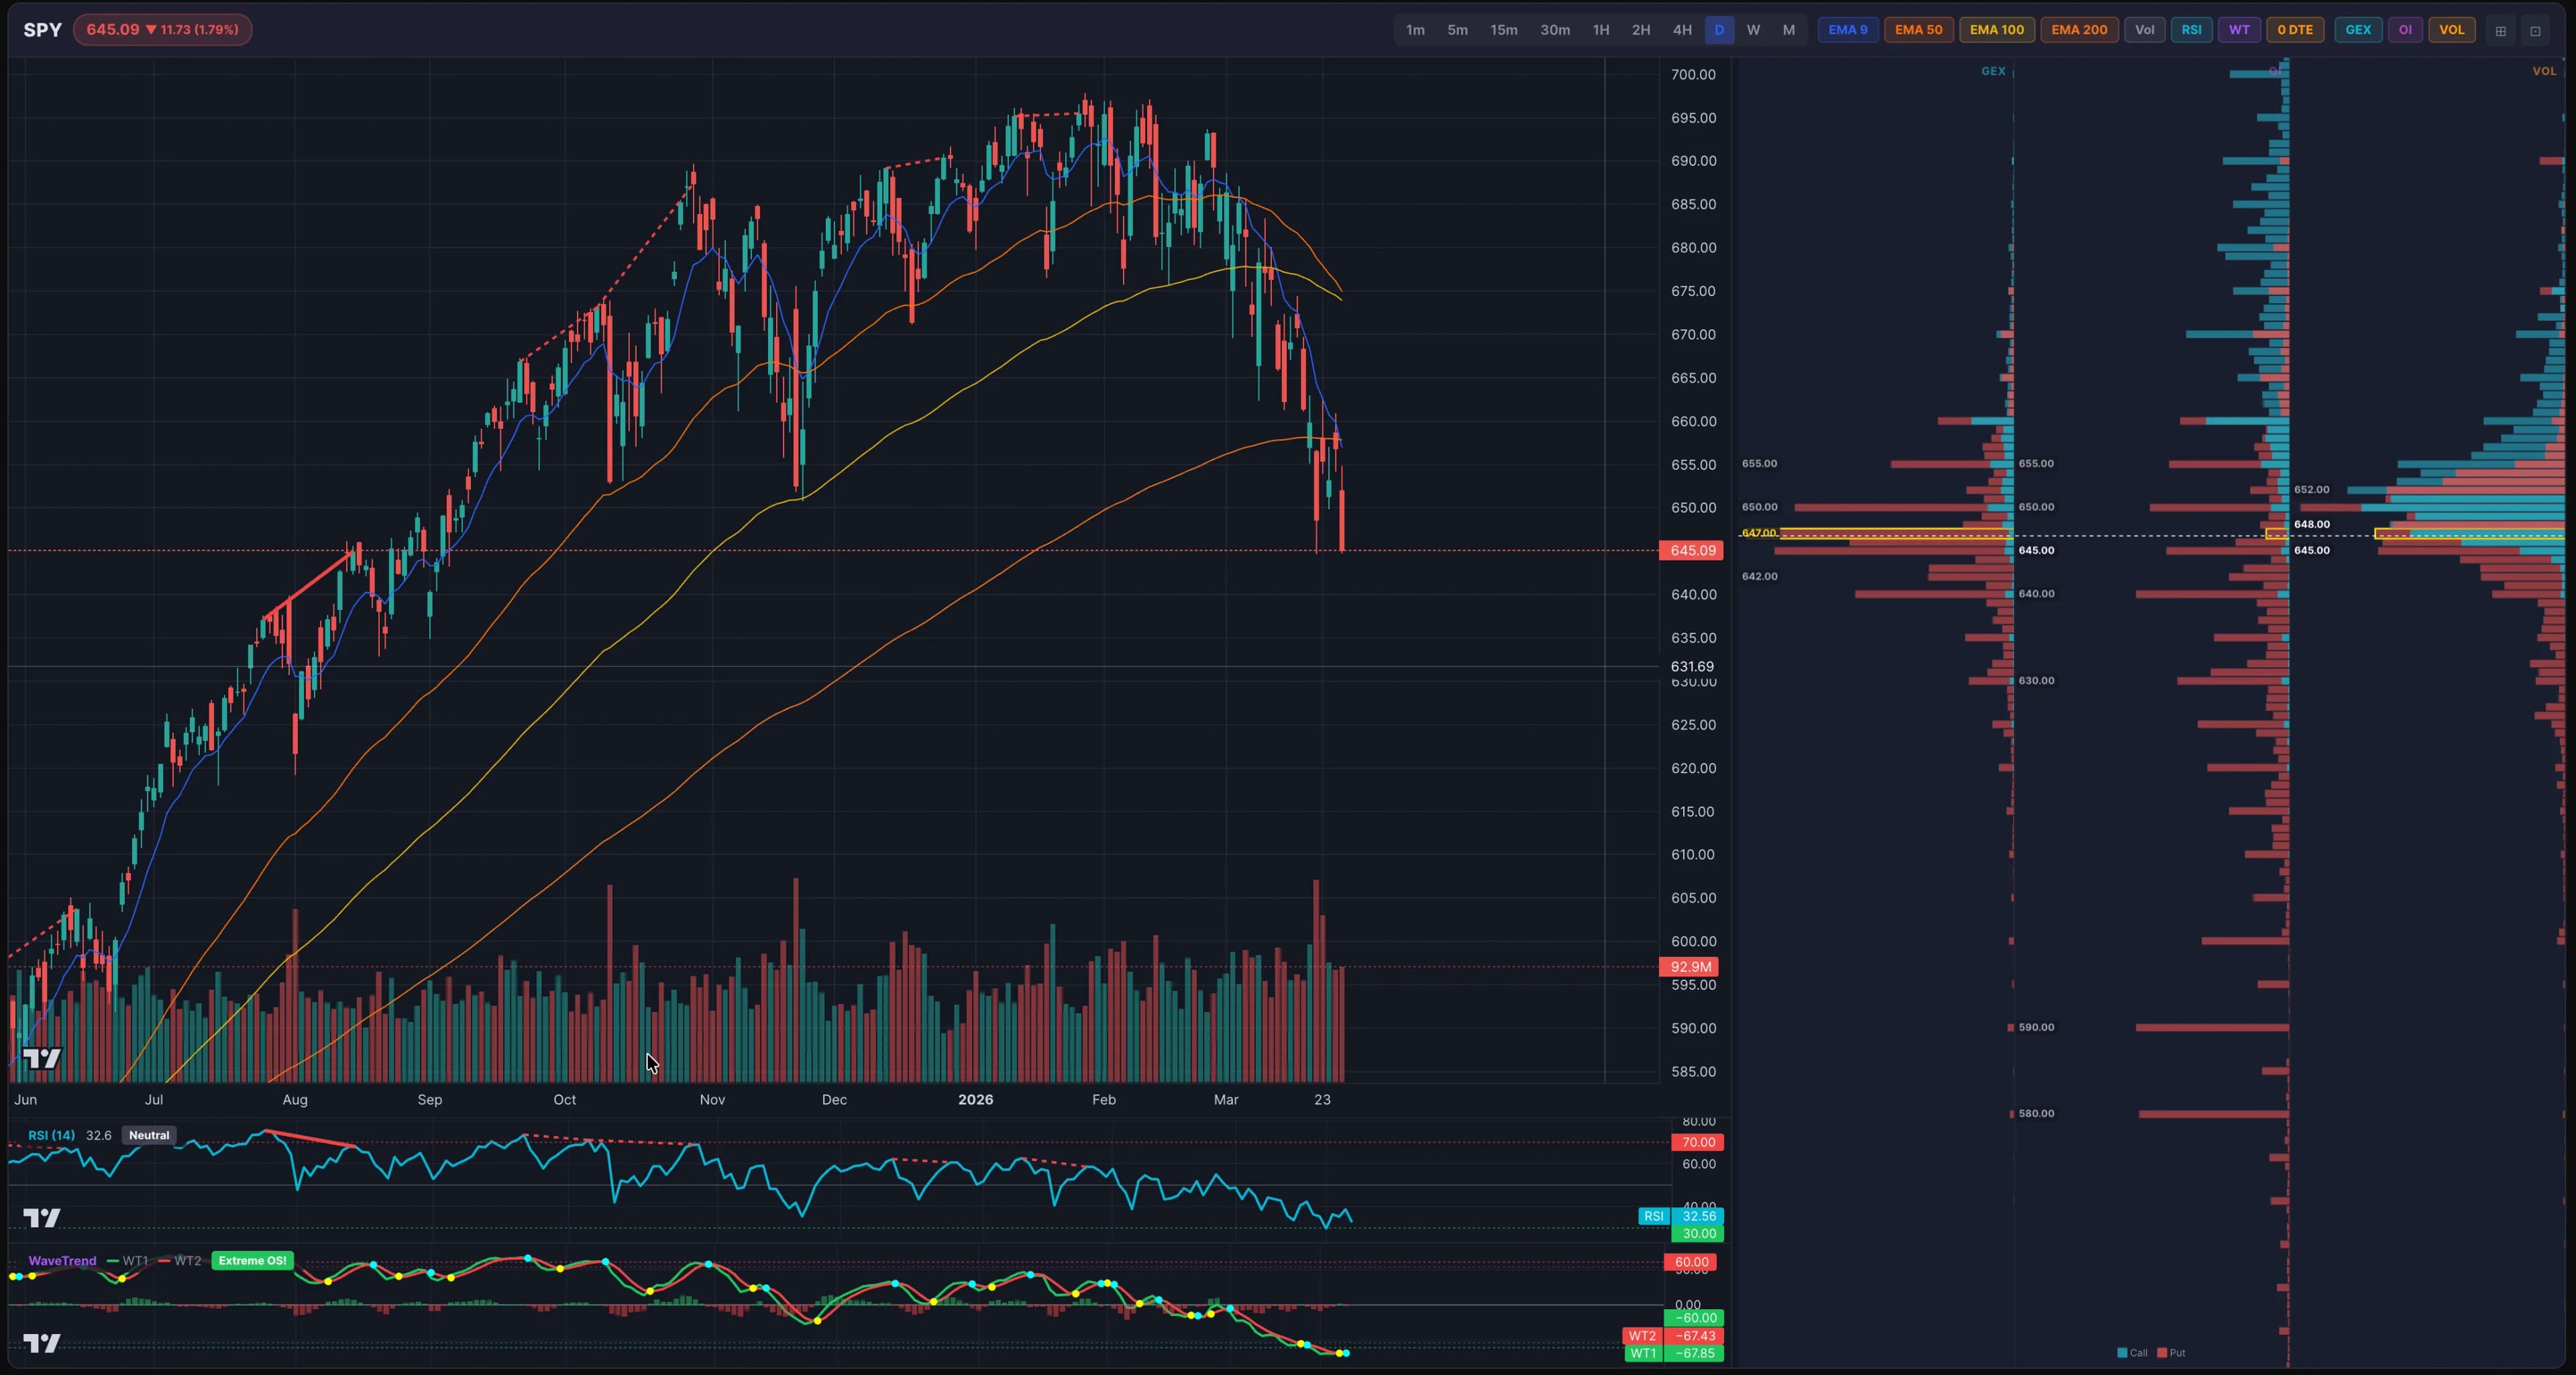
Chart View

Price Charts with GEX Level Overlays

Professional candlestick chart with gamma exposure levels plotted directly on price. See key GEX nodes as horizontal levels and observe how price interacts with high-gamma zones in real time.

  • GEX levels on chart
  • King Strike overlay
  • Flip point markers
  • Intraday & multi-day
Open Chart View
Chart View
Live Flow

Real-Time Options Activity Monitor

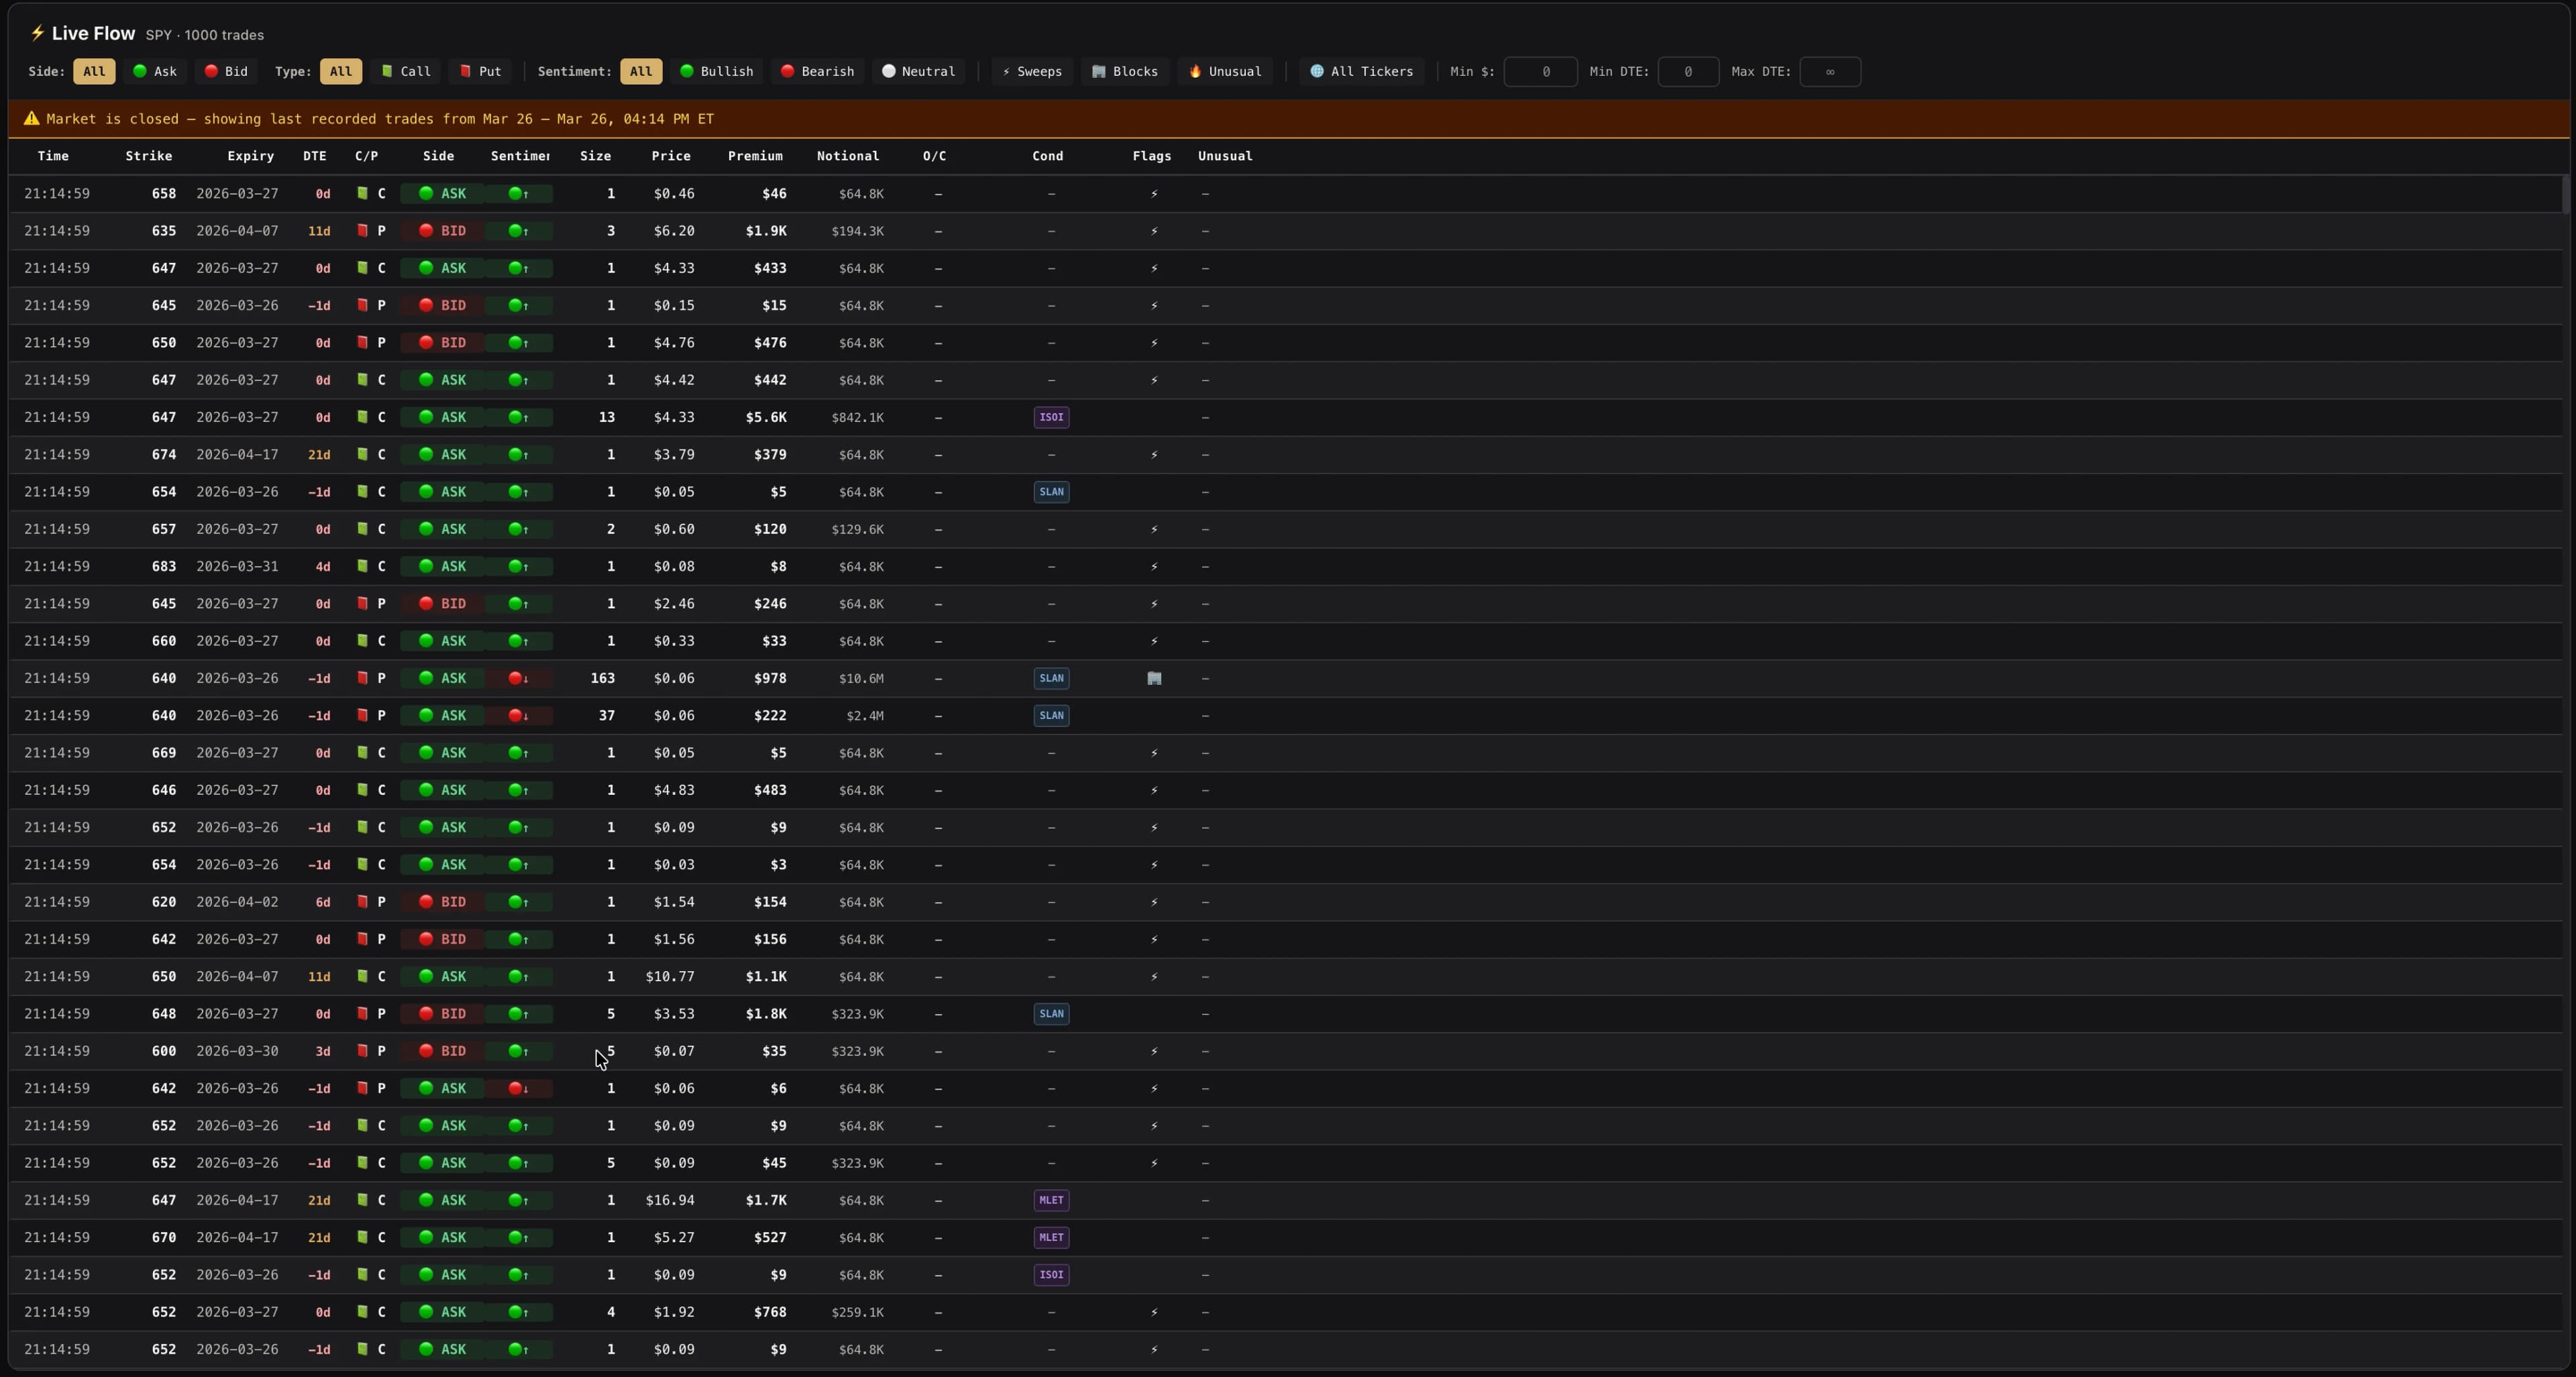
Live feed of unusual options activity across the market. Filter by size, premium, sentiment, and ticker. See large orders as they appear — not hours later.

  • Real-time activity feed
  • Premium & size filters
  • Directional sentiment
  • Multi-ticker view
Open Live Flow
Options Activity Feed
Sentiment

Options-Derived Sentiment Dashboard

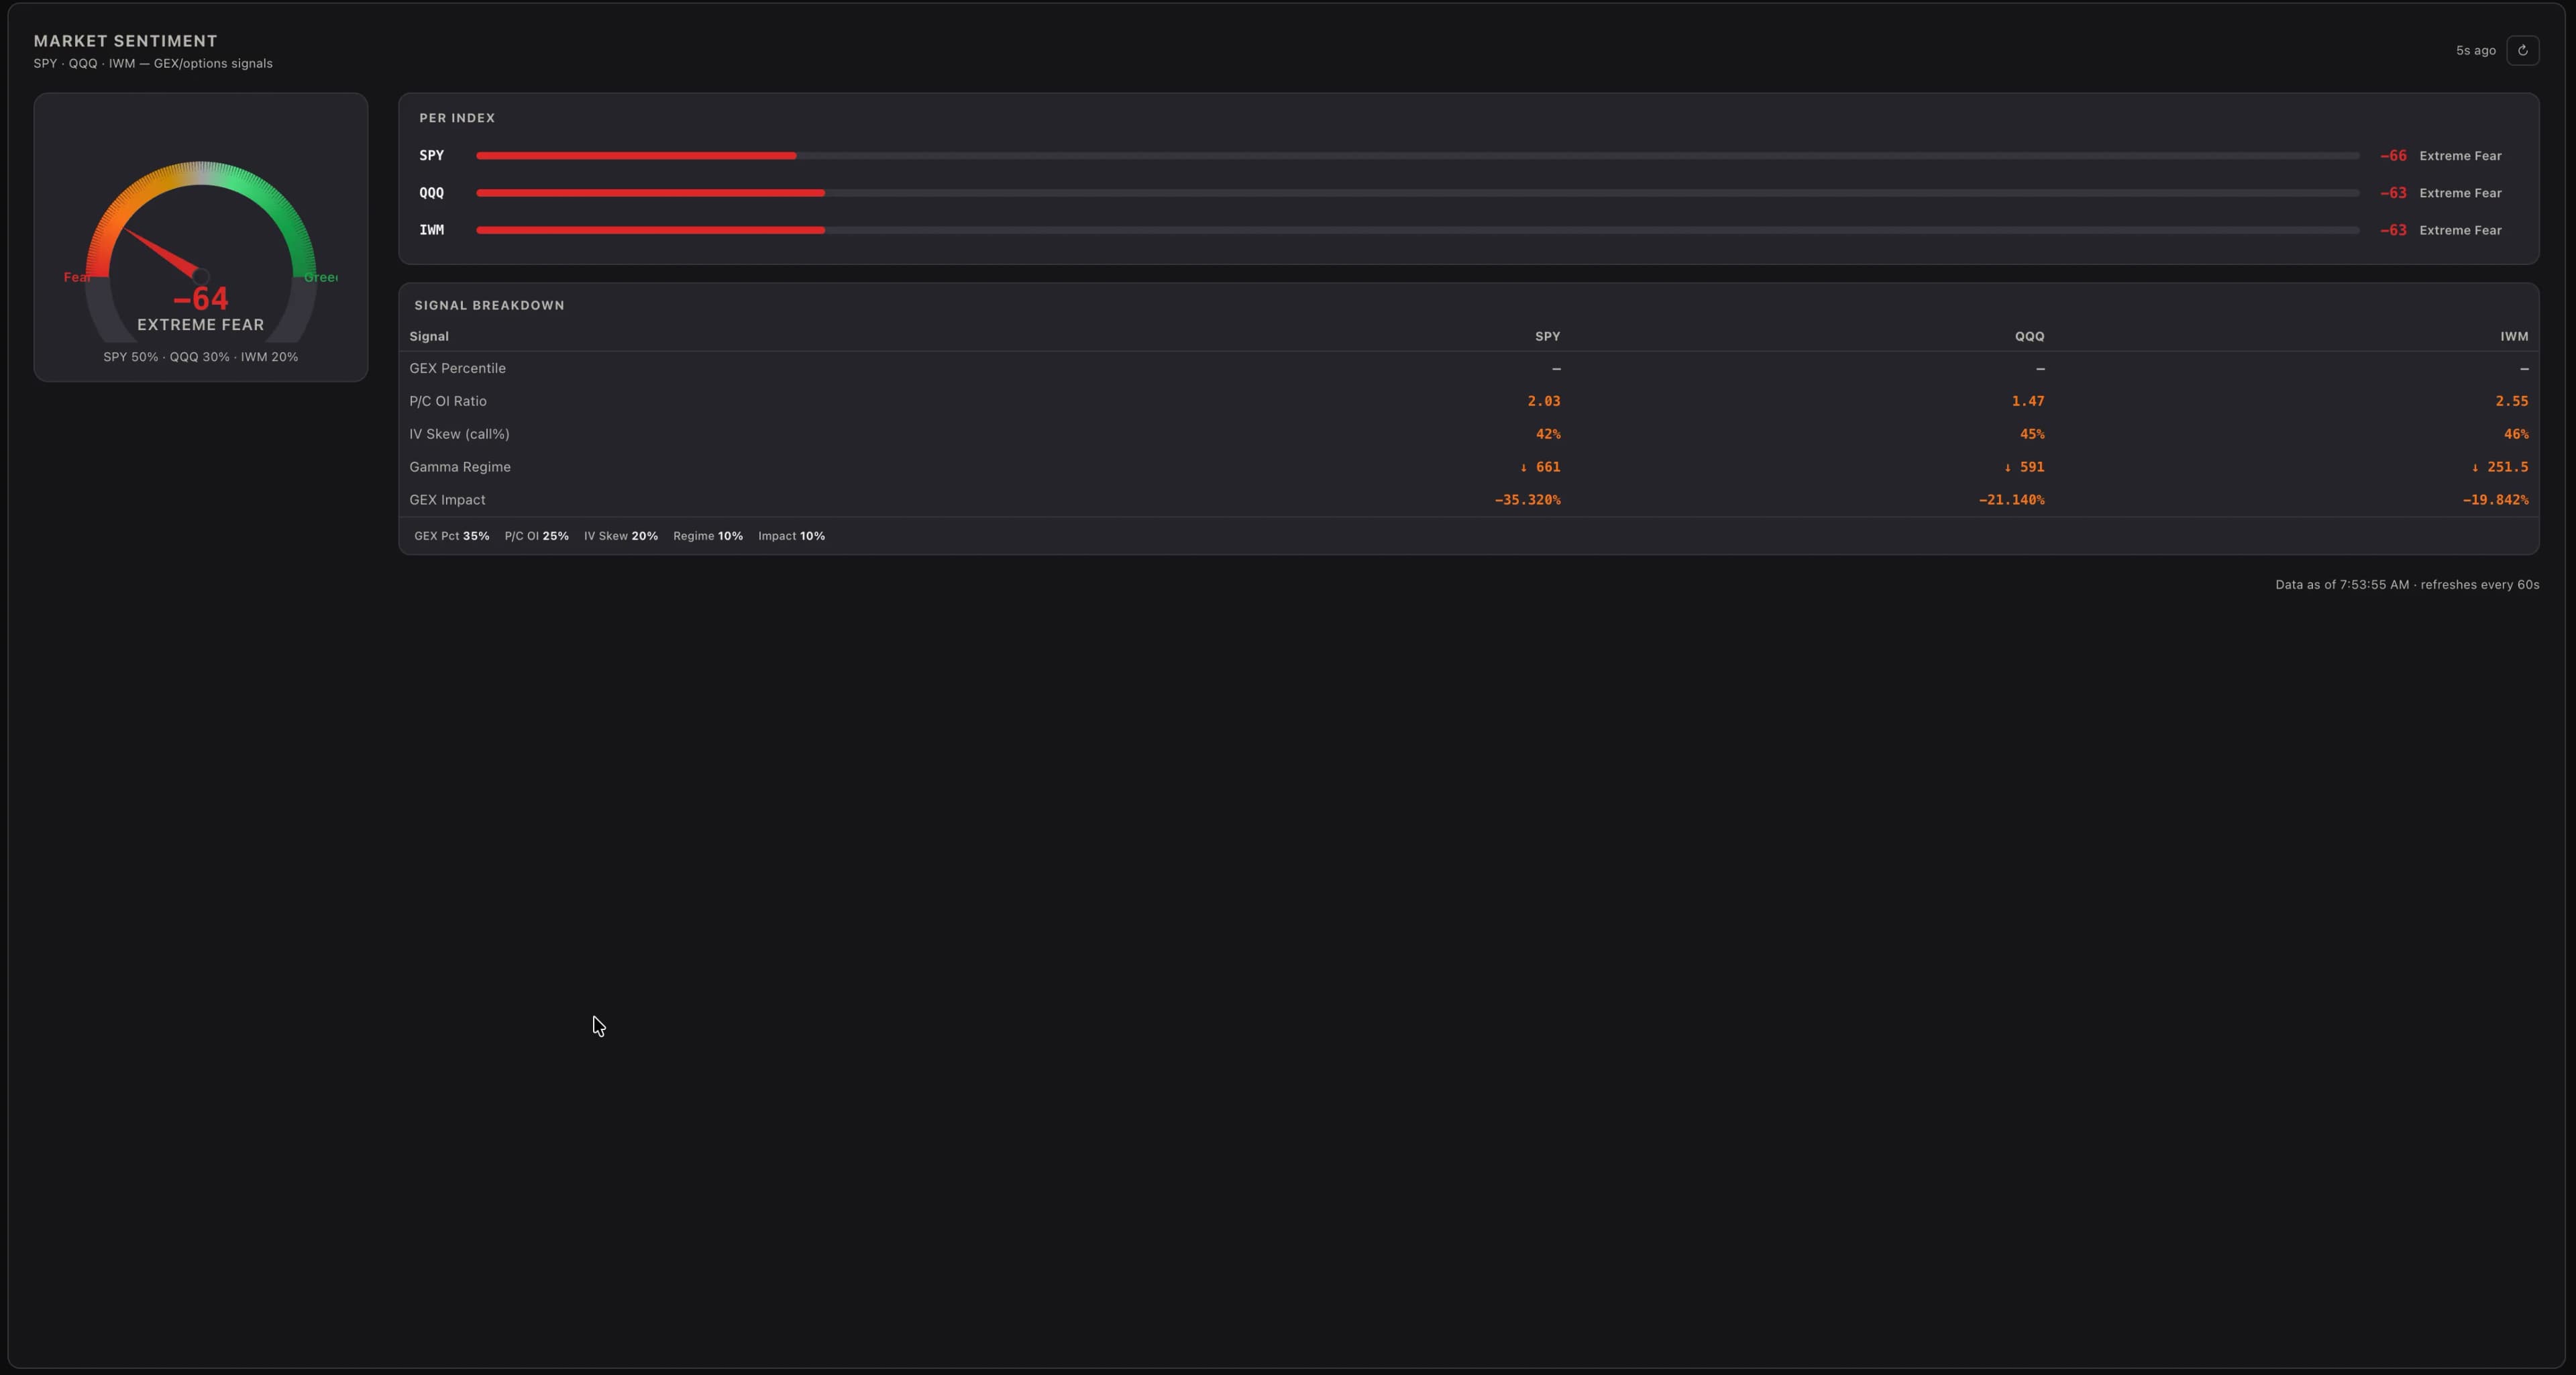
Synthesized view of overall market positioning derived from options data. Explore put/call ratios, net gamma exposure, and positioning metrics across the entire market at a glance.

  • Market-wide GEX
  • Put / call ratio
  • Positioning metrics
  • Historical context
Open Sentiment
Sentiment Dashboard
3D Surface

Volatility Surface in 3D

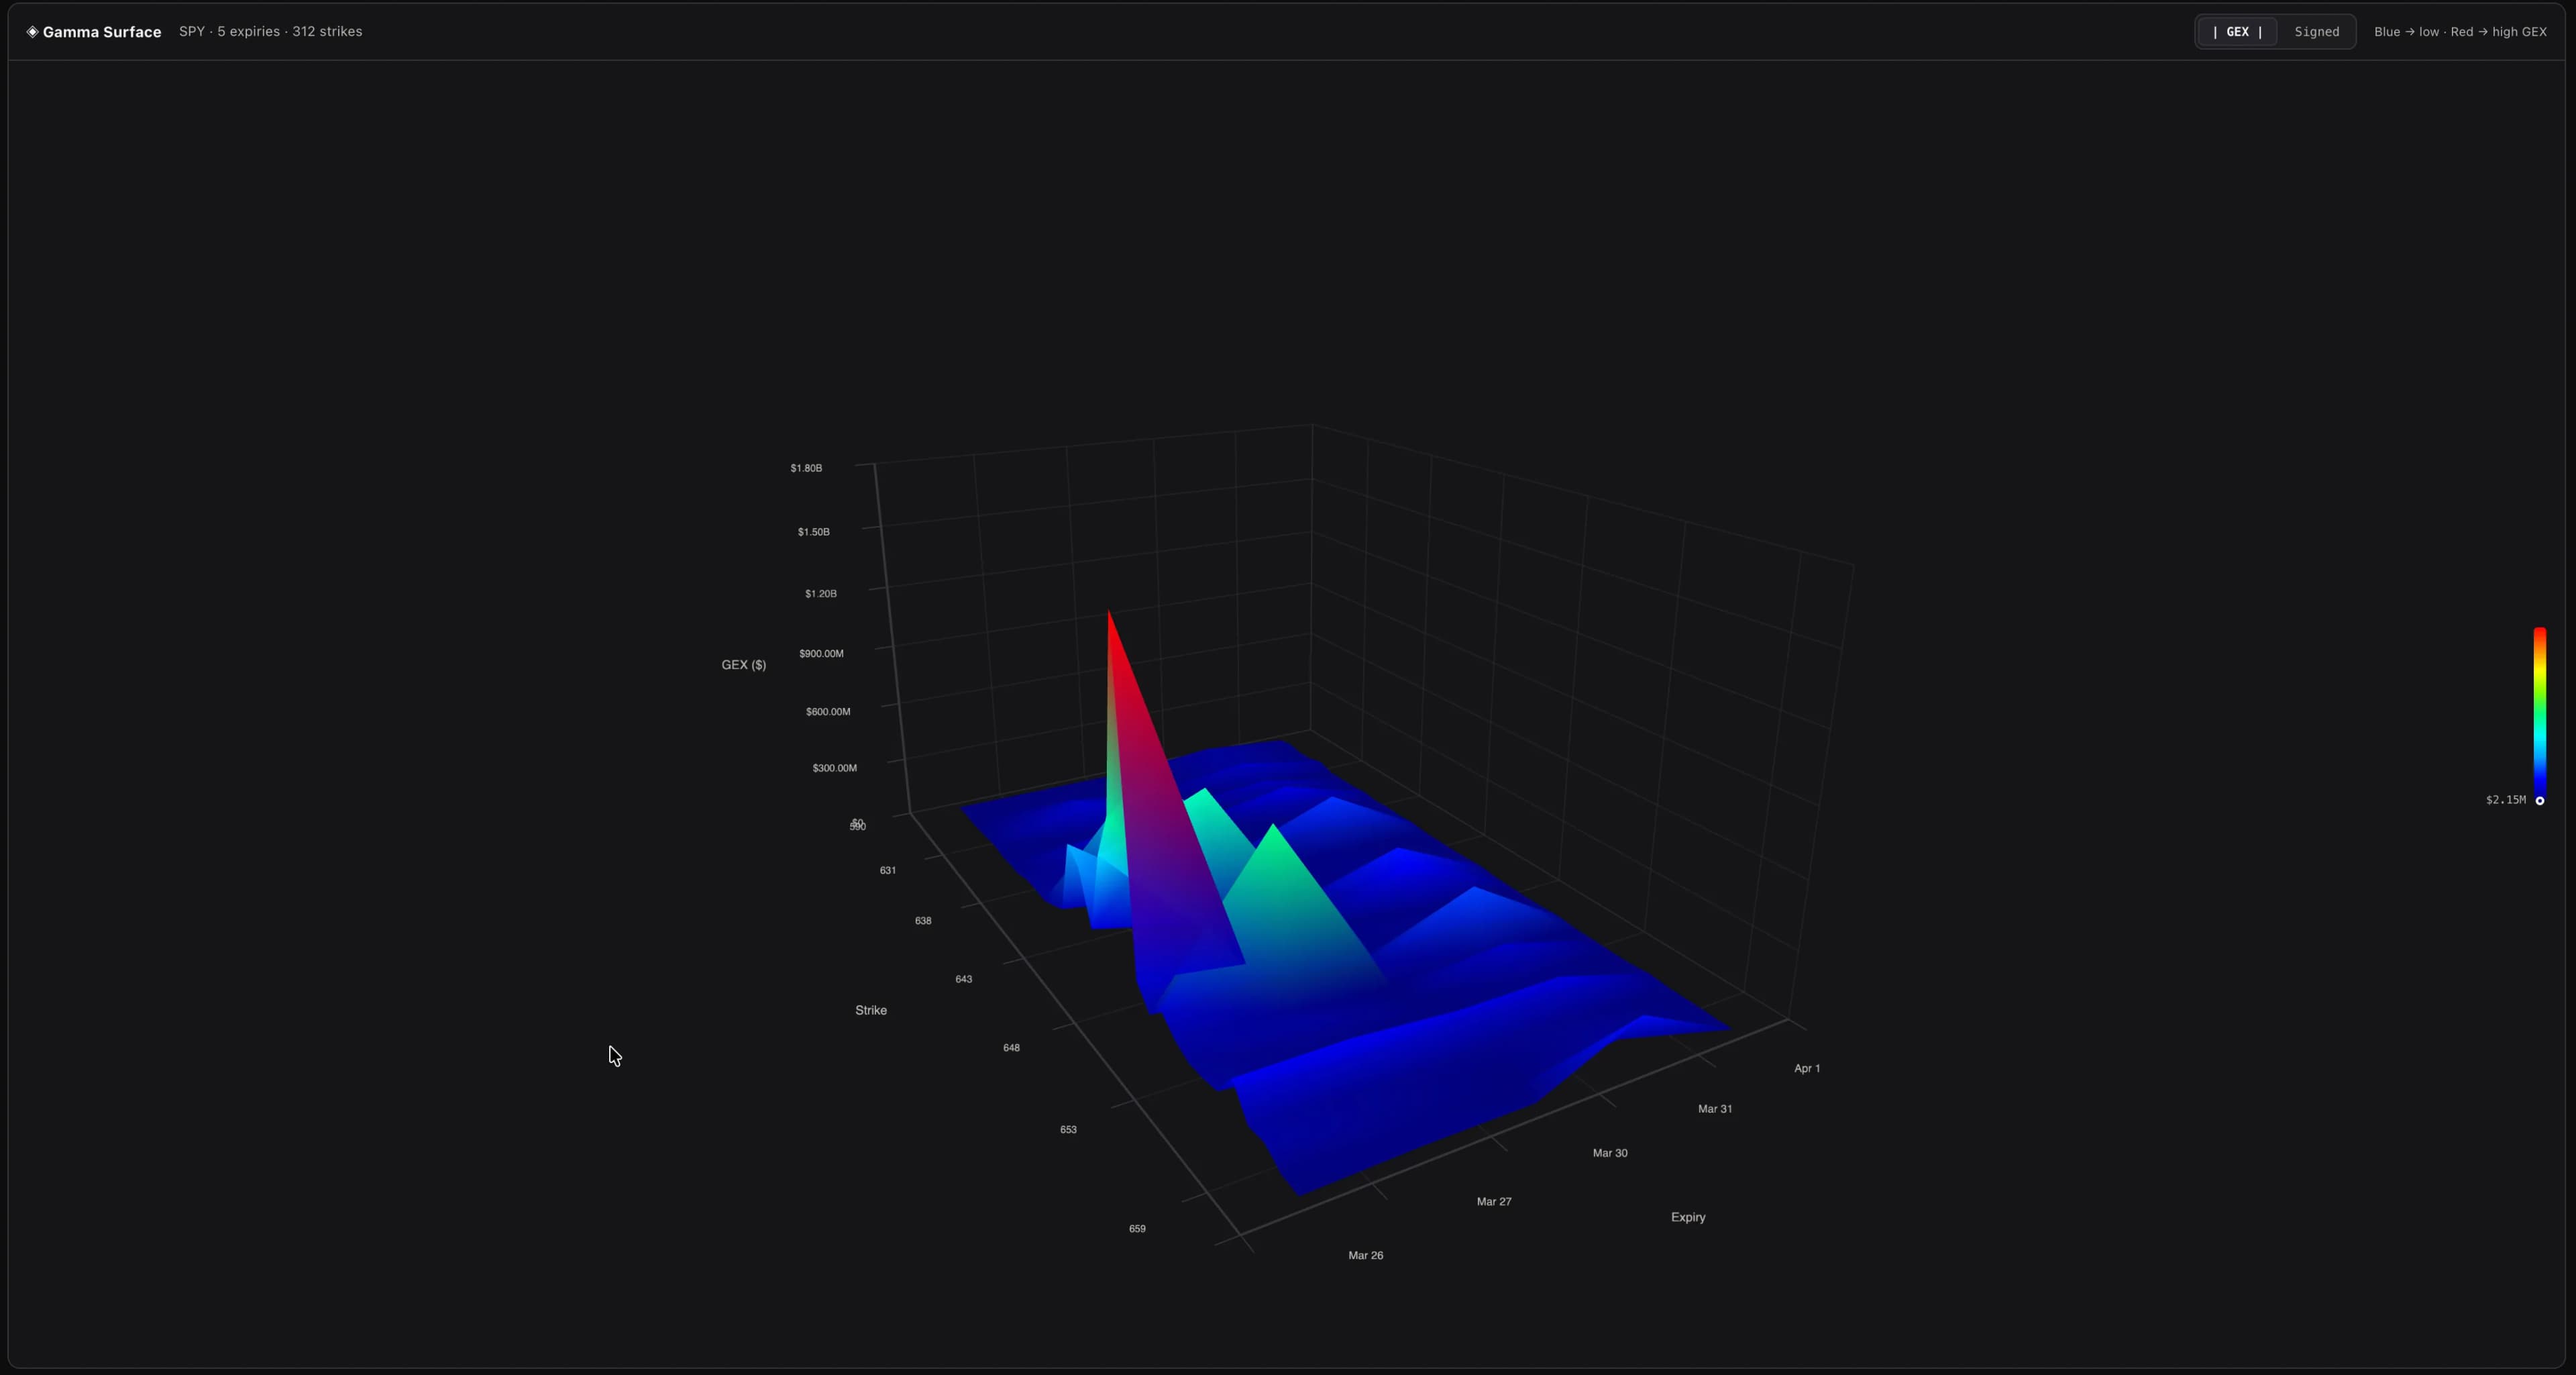
Rotate and explore the implied volatility surface across all strikes and expirations in three dimensions. Identify volatility skew, term structure anomalies, and unusual IV concentrations instantly.

  • Full IV surface
  • Strike × expiry × IV
  • Interactive rotation
  • Skew visualization
Open 3D Surface
3D Volatility Surface
Compare

Side-by-Side Multi-Ticker View

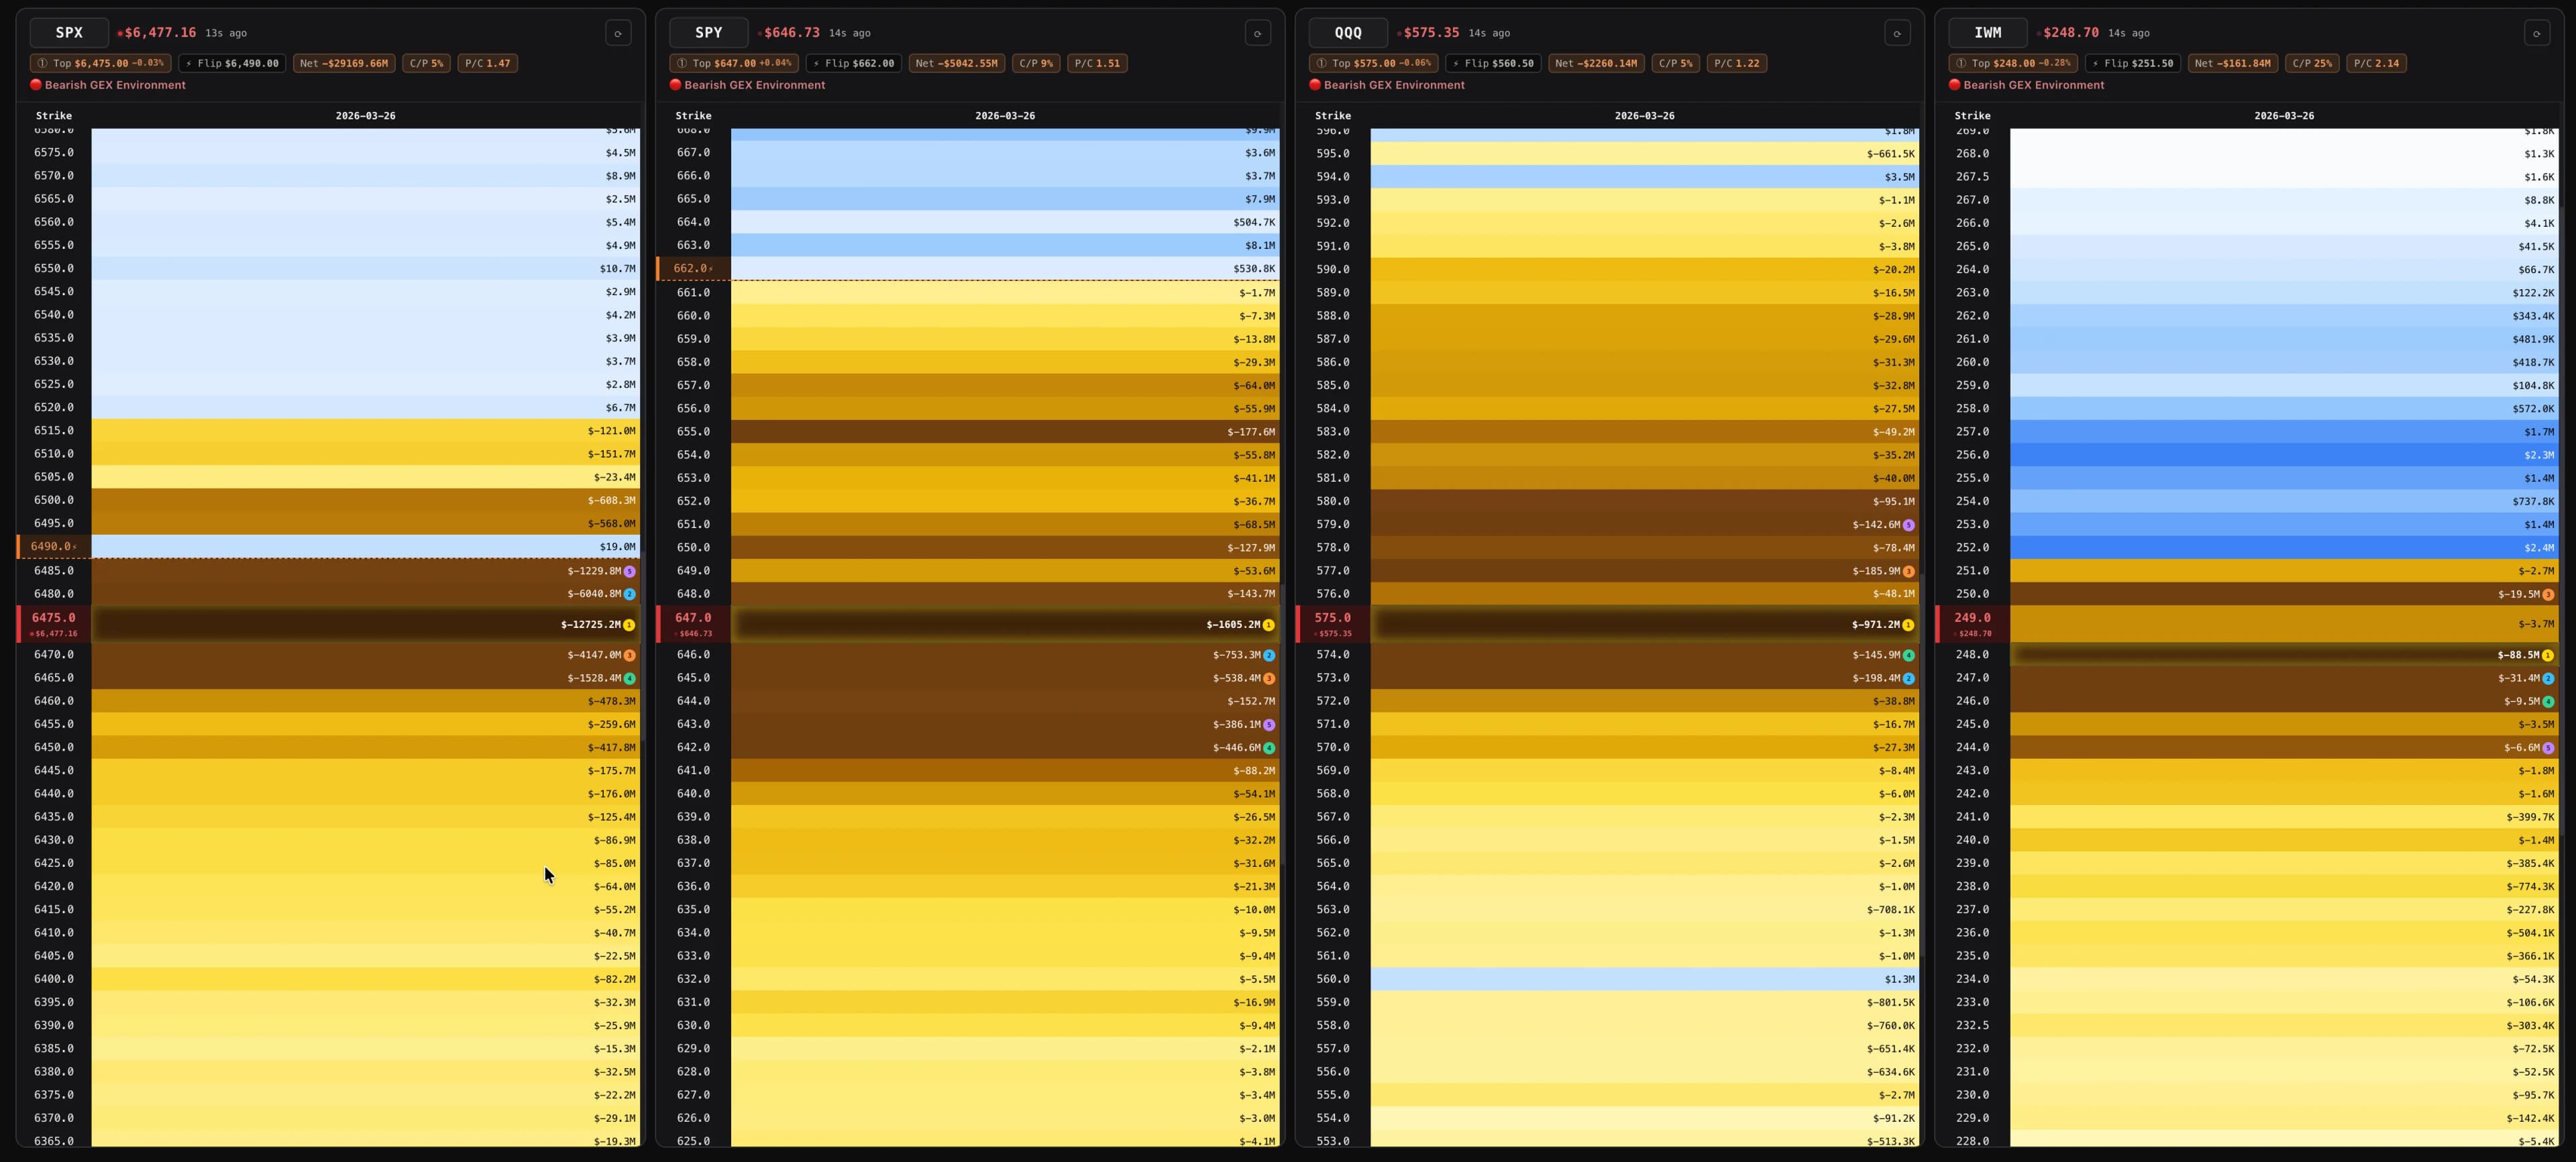
Compare multiple tickers simultaneously. View GEX profiles, King Strikes, net gamma, and sentiment indicators side by side to explore relative positioning across symbols.

  • Multi-ticker grid
  • GEX profile comparison
  • Net gamma bars
  • King Strike proximity
Open Compare
Compare View

Get in Touch

Questions, feedback, or partnership inquiries? We would love to hear from you.