Part IV — Advanced Two-Legged Hunting · 7 min read
Straddle and Strangle — Betting on Volatility

"Knowing direction is an art. Knowing that direction _does not matter is a different art entirely."_
The Two Volatility Structures
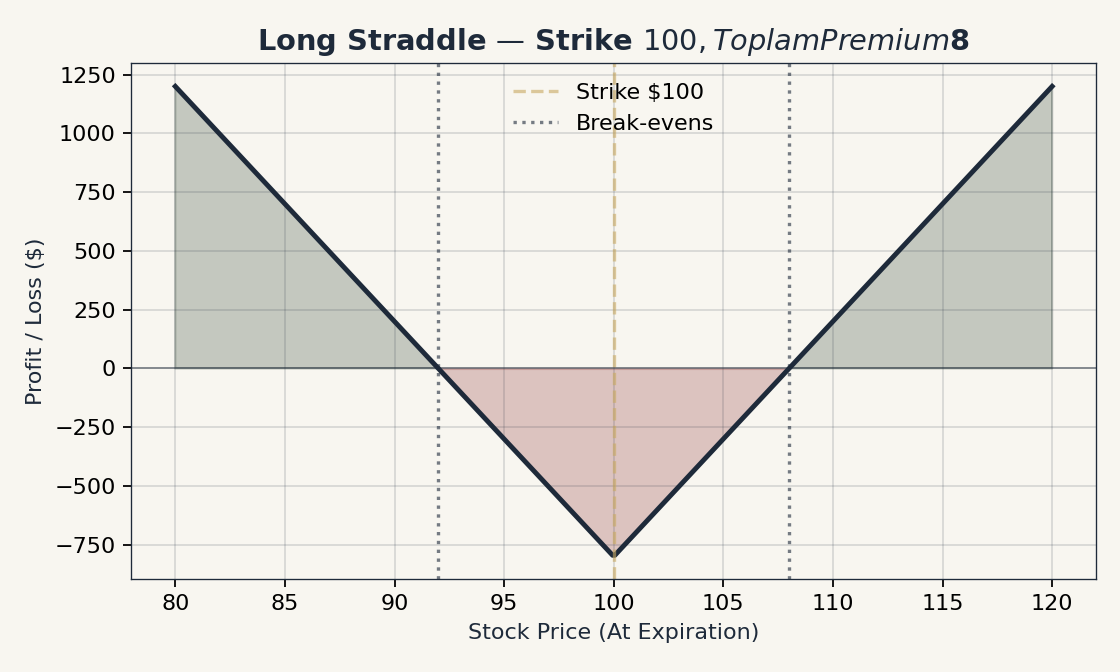
A straddle is a long ATM call + long ATM put, same strike, same expiration.
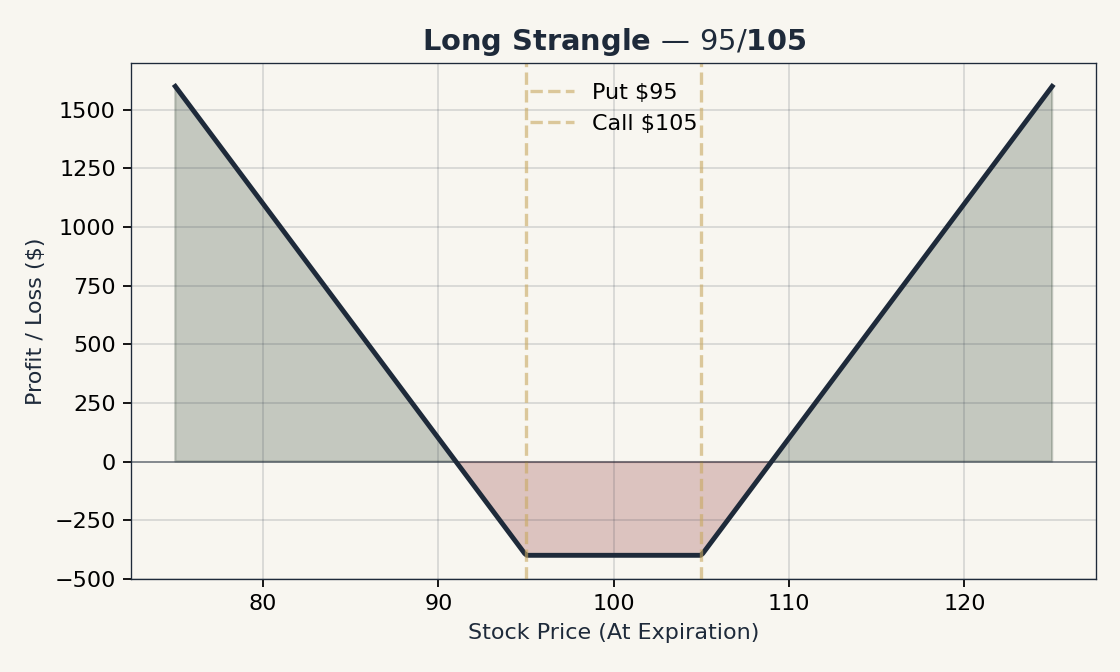
A strangle is a long OTM call + long OTM put, different strikes, same expiration.
Both are long volatility in their natural form. You profit when the underlying moves significantly in either direction. You lose when the underlying stays still (theta) or when implied volatility drops (vega).
Long Straddle
Mechanic
-
Buy 1 ATM call + buy 1 ATM put, same strike, same expiry.
-
Pay a net debit (both premiums).
-
Make money if the underlying moves significantly up or down before expiry.
-
Lose money if the underlying stays at strike (both options decay) or if IV falls.
Example
AAPL at $175, 30 DTE.
-
$175 call: $4.00
-
$175 put: $4.00
-
Total debit: $8.00 = $800 per straddle.
For the straddle to break even at expiry, AAPL must be at $167 or $183. For a meaningful win, AAPL needs to move 5-10% in some direction. If the stock parks at $175 for 30 days, you lose nearly the entire $800.
Long Strangle
Mechanic
-
Buy 1 OTM call + buy 1 OTM put, different strikes, same expiry.
-
Cheaper than a straddle (both legs OTM, less premium).
-
Requires a larger move for profit, because the break-evens are further from current price.
Example
AAPL at $175, 30 DTE.
-
$180 call: $1.50
-
$170 put: $1.50
-
Total debit: $3.00 = $300.
Break-evens: $183 (call strike + total premium) and $167 (put strike − total premium). The required move is the same 5% as the straddle — but at half the cost. The trade-off: between $170 and $180, the strangle expires worthless. The straddle, in contrast, retains some value at any point that is not exactly $175.
The Earnings Trap — IV Crush
|
Straddles and strangles into earnings are the most-misunderstood trades in retail options. The night before earnings, IV on the underlying is at its peak — sometimes 100-200% annualized. The straddle is expensive. The implied move (calculated from the straddle price) tells you how much the market expects the stock to move. The morning after earnings, IV collapses. Even if the stock moves 5%, the straddle’s vega loss may exceed the delta gain. You can be right about direction and magnitude, and still lose money. A widely-cited rule of thumb: the long straddle/strangle into earnings loses approximately 60% of the time, even on volatile names. The reason is that the implied move is, on average, slightly larger than the actual move (the market over-prices uncertainty into binary events). The historical edge has been on the short side — but the short side is exposed to the rare large move (Sinclair, 2013, Ch 8-9). |
Short Straddle and Short Strangle — The Other Side
Mechanic
-
Sell ATM call + sell ATM put (short straddle).
-
Sell OTM call + sell OTM put (short strangle).
-
Collect a net credit.
-
Profit if the underlying stays in a range — or specifically, moves less than the implied move.
The Risk
|
Short straddles and short strangles are naked positions. The risk is theoretically unlimited on the call side and substantial on the put side. A surprise move can wipe out years of profits in a single event. Most retail traders should not sell naked strangles. The risk-defined version is the iron condor or iron butterfly (Chapter 16). |
When To Use
-
IV is extremely high (top 5-10% of its 52-week range).
-
You have a strong view that the implied move is overestimated.
-
You can absorb a multiple-standard-deviation loss without breaking your account.
Even then, prefer the iron-condor variant unless you have substantial account size and a specific reason to take the unbounded risk.
Reading the Implied Move
The implied move is approximately the cost of the at-the-money straddle divided by the underlying price, expressed as a percentage.
For a $175 stock with the ATM straddle priced at $8:
-
Implied move ≈ 8/175 = 4.6%.
-
The market is pricing in a ±4.6% one-standard-deviation move by expiry.
If you have a view that the actual move will be larger than implied, buy the straddle. If you think it will be smaller, sell.
Empirical work (Sinclair, 2013; Tompkins, 1994) shows the implied move is, on average, slightly larger than the realized move. This is the "volatility risk premium" — the market pays a premium to insure against uncertainty, and on average, that premium exceeds the realized cost of the insurance. This is the structural edge for premium sellers.
But average is not always. A specific event can produce a move that is multiples of the implied. That is the risk.
Greeks Profile
| Greek | Long Straddle | Short Straddle |
|---|---|---|
Delta |
~0 at the strike |
~0 at the strike |
Theta |
− (your enemy, premium decays) |
+ (your friend) |
Vega |
+ (long volatility) |
− (short volatility) |
Gamma |
+ (favorable on big moves) |
− (catastrophic on big moves) |
Management
-
Long: take profit if either side becomes a clear winner (e.g., delta > 0.70). Cut at 50% loss on total debit.
-
Short: take profit at 25-50% of credit. Manage at 21 DTE. Close immediately on a significant adverse move.
Volatility as a Tradeable Asset
The deeper insight from Sinclair (2013) and others: volatility is a separate, tradeable asset class. You can be long or short volatility independent of underlying direction.
For a retail trader, this lens is liberating:
-
You do not need a directional view to trade options.
-
You need a view on whether the market is overpricing or underpricing future variance.
-
The tools to take a view: straddles, strangles, calendars (vega), and condors (anti-vega).
This is the door to volatility trading — a body of practice with its own literature (Natenberg, 2014; Sinclair, 2013) and its own scars.
Next Chapter
Chapter 18 closes Part IV with the strategic view: how to read the VIX as a regime indicator, what to do when it is high versus low, and how to hedge a portfolio (not just a single position). After that, Part V turns from the strategies to you — the long game, the discipline, the criteria for safe vs risky trades.