Total Gamma Exposure: How Dealer Gamma Moves Markets
The options market has grown large enough that it now shapes the stocks and indices beneath it. Total gamma exposure measures how options dealers are positioned across every strike and expiration — and the sign of that gamma tells you whether their hedging is likely to calm price or amplify it. This guide explains what gamma means, how dealer gamma drives market moves, and how to read it on a live GEX profile.
What does gamma mean in options?#
Start with delta. Deltameasures how much an option’s price changes for a $1 move in the underlying. Option gamma is the rate of change of that delta — so the plain-English gamma meaning is the accelerationof directional exposure. A position with high gamma sees its delta swing quickly as the underlying moves; a low-gamma position barely shifts. In gamma trading, that distinction is everything: it sets how fast both your exposure and a dealer’s hedge must change.
Gamma is not constant. It peaks for at-the-moneyoptions and fades as a strike moves deep in- or out-of-the-money, because a far-away option’s delta is already pinned near 1 or 0 and has little room to change. The illustrative bell curve below shows option gamma by strike for a stock trading at $100:
Option gamma by strike — illustrative
Two more properties matter. Gamma rises sharply as expiration approaches — a near-dated at-the-money option has far more gamma than a long-dated one. And higher implied volatility tends to flatten the curve, spreading gamma across a wider band of strikes rather than concentrating it at the money. Both effects feed directly into how dealers hedge.
Why dealer gamma moves markets#
The key players are options dealers (market makers). They exist to provide liquidity, not to bet on direction, so they take the other side of customer orders and then hedge to stay delta-neutral — buying or selling the underlying to offset the directional risk they just absorbed. Gamma dictates how much that hedge has to change as price moves, and the sign of their aggregate gamma decides whether that hedging stabilises price or destabilises it.
Aggregate the gamma every dealer carries across all strikes and expirations and you get total gamma exposure, usually reported as net GEX (Gamma Exposure). Net GEX is the roadmap: it shows where mechanical hedging flows are likely to cluster and which regime the market is in.
Positive vs negative gamma: a tale of two regimes#
The single most useful thing total gamma tells you is which regime the market is in. The two behave in opposite ways:
- Positive (long) gamma. Dealers sell into rallies and buy into dips to stay neutral. That hedging leans against the move, dampening volatility. Markets tend to grind, with shallow pullbacks and compressed ranges.
- Negative (short) gamma. Dealers buy into rallies and sell into dips — hedging in the same direction as the move. That creates a feedback loop that accelerates price in either direction, producing choppy, trend-prone sessions.
| Positive gamma (long) | Negative gamma (short) | |
|---|---|---|
| Dealer hedging | Sells rallies, buys dips | Buys rallies, sells dips |
| Effect on price | Dampens moves — mean reversion | Amplifies moves — trend & acceleration |
| Typical volatility | Lower, range-bound | Higher, prone to air pockets |
| What to watch | Pinning near big strikes | Fast moves once the flip breaks |
| Strategy fit | Mean-reversion (condors, credit spreads) | Directional breakouts |
Illustrative regime read
The boundary between the two is the gamma flip (also called the zero-gamma level) — the price at which total dealer gamma crosses from positive to negative. Above it the market is usually calm and mean-reverting; below it, dealer hedging tends to amplify moves. That is why selloffs that break the flip so often accelerate: the hedging flow switches from stabilising to destabilising.
How GEX levels become support and resistance#
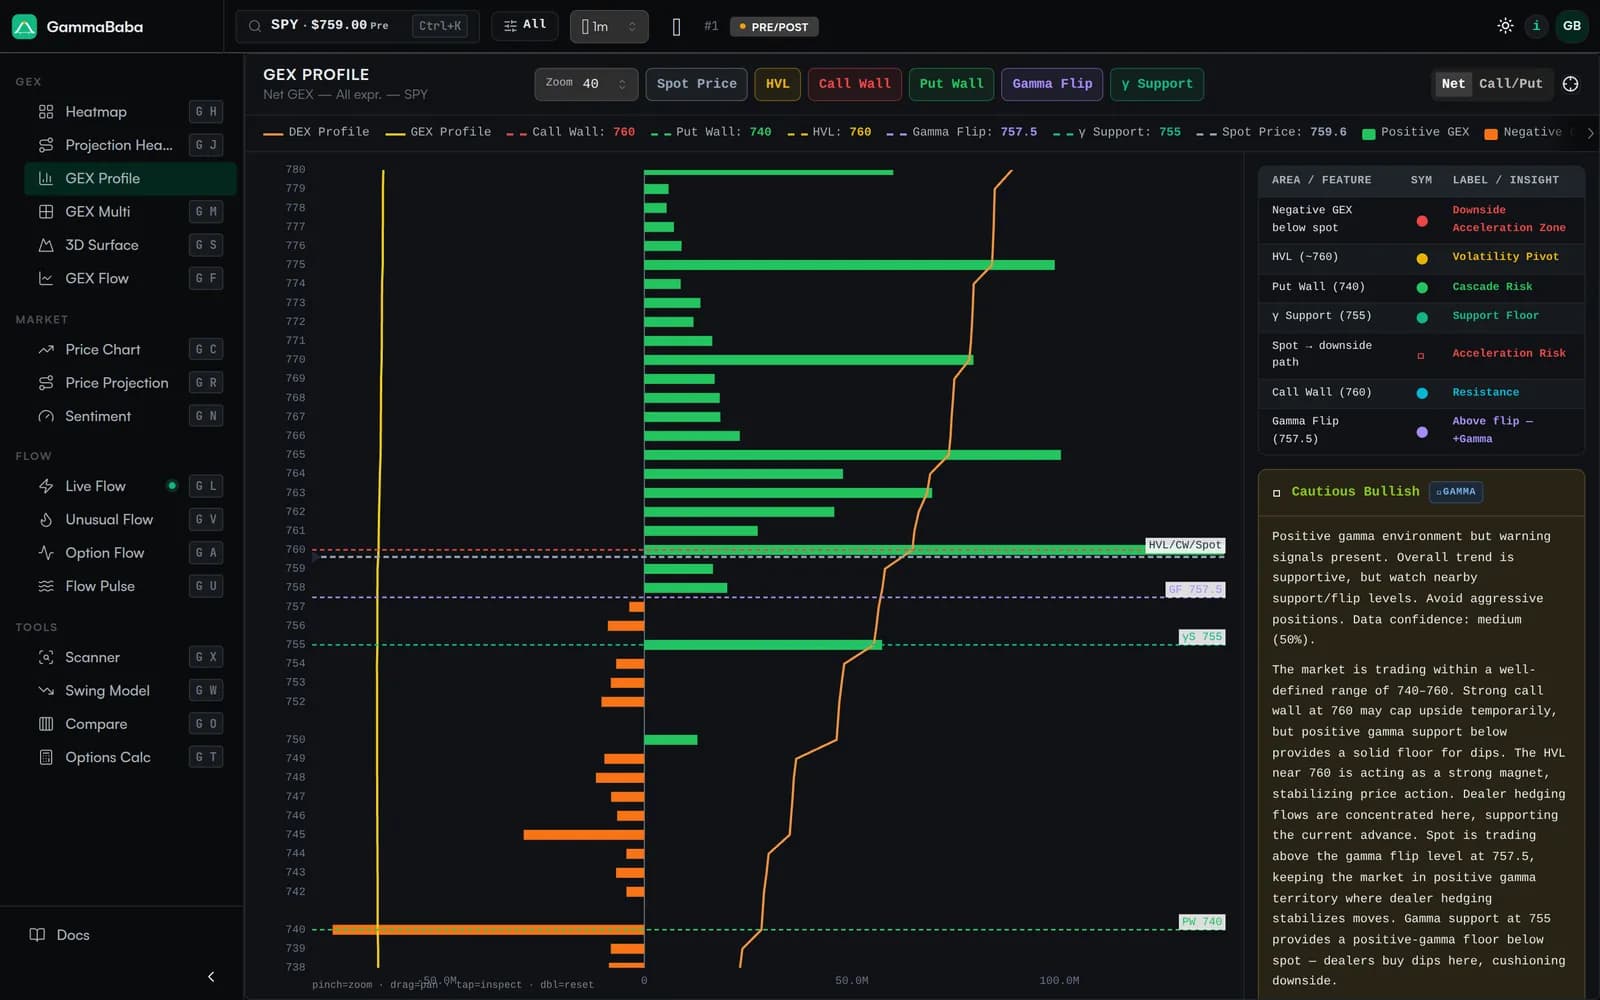
Because gamma concentrates at strikes with heavy open interest, GEX profiles reveal levels that act like structural support and resistance. The illustrative profile below plots net gamma by strike for a stock near $100 — positive (call-dominated) bars in green above spot, negative (put-dominated) bars in red below:
Net GEX by strike — illustrative
- Call walls. In a positive regime, large clusters of calls form upside resistance: dealers sell the underlying into a rally to hedge, leaning against the move.
- Put walls. Large put concentrations form downside support: dealers buy the underlying as price drops to hedge, cushioning the fall — until that level gives way.
GammaBaba renders this structure as a colour heatmap and a net-by-strike profile, so you can spot the King Strike, walls and flip at a glance for any optionable ticker. See Reading the Heatmap for a guided tour, or What is GEX? for the fundamentals.
Expiration, pinning and 0DTE gamma#
Hedging requirements peak around major options expirations (OpEx), when gamma concentrates around the strikes with the heaviest open interest. That is the source of pin risk: dealer hedging can pull a stock toward a heavily traded strike into the close, so positive-gamma names often “pin” near a round number on expiration day.
Same-day (0DTE) options sharpen this further. Because gamma is largest right before expiration, a 0DTE option carries an outsized, knife-edge gamma profile, and a sudden influx of volume can force dealers into immediate hedging. When that flow catches dealers short out-of-the-money calls, a short gamma squeeze can follow: as price rises, dealers buy shares to stay neutral, pushing it higher still. For the mechanics and risks of same-day options, see 0DTE Options Risk, and for the index picture read SPX Net GEX Explained.
Trading the gamma regime#
You do not need to forecast gamma to use it — you adapt to it. A few practical habits turn total gamma exposure into an edge:
- Identify the regime first. In heavy positive gamma, fade extremes and lean on mean-reversion structures. In negative gamma, respect breakouts and size for faster, larger moves.
- Mark the flip and the walls. Treat the gamma flip as a regime switch and the call/put walls as soft magnets — levels where momentum tends to stall or reverse.
- Watch the flow into the flip. Heavy positioning building near the flip can tip you off to a regime change before price confirms it.
- Mind expiration. Be cautious initiating swing trades right before major OpEx; let the heaviest hedging and pin risk pass before committing capital.
Gamma positioning also feeds market sentiment. GammaBaba’s Sentiment view blends gamma regime with options flow so you can see, at a glance, whether dealer hedging is leaning with or against the tape.

Track total gamma exposure on GammaBaba#
GammaBaba computes gamma exposure across the US options universe and refreshes it through the session. Open the GEX heatmap for the strike-by-strike picture, drop into the GEX Profile for the net-by-strike view with the King Strike, walls and flip marked, or pair it with Sentiment to read the regime in context.
Frequently asked questions
What does gamma mean in options trading?
Gamma is the rate of change of an option's delta for a $1 move in the underlying — in plain terms, the acceleration of directional exposure. It is highest for at-the-money options and rises sharply as expiration approaches, which is why hedging activity concentrates near the current price and into expiry.
What is total gamma exposure?
Total gamma exposure, usually reported as net GEX, is an estimate of all the gamma options dealers carry across every strike and expiration of an underlying. Its sign indicates whether dealer hedging is likely to dampen price moves (positive gamma) or amplify them (negative gamma), and its distribution by strike reveals magnets and walls.
How does dealer gamma move the market?
Dealers hedge their options to stay delta-neutral by trading the underlying. In positive gamma they sell rallies and buy dips, which calms price. In negative gamma they buy rallies and sell dips, which accelerates moves. Because dealer hedging volume is large, this mechanical flow can stabilise or destabilise the whole market.
What is the gamma flip level?
The gamma flip, or zero-gamma level, is the price at which total dealer gamma crosses from positive to negative. Above it the market is usually calm and mean-reverting; below it dealer hedging tends to amplify moves, which is why a selloff that breaks the flip often speeds up.
What are call and put walls?
Call and put walls are strikes with large concentrations of gamma from heavy open interest. Call walls sit above spot and tend to cap rallies as dealers sell to hedge; put walls sit below spot and tend to support price as dealers buy to hedge — until that level breaks.
Why do 0DTE options matter for gamma?
Gamma peaks right before expiration, so same-day (0DTE) options carry an outsized, knife-edge gamma profile. A surge of 0DTE volume can force dealers into immediate hedging, fuelling intraday pins and short gamma squeezes, and that gamma can vanish at the close as the options expire.