🗺️ Reading the GEX Heatmap
The heatmap is the fastest way to see where dealer gamma is concentrated. One glance tells you which strikes act as magnets, which can accelerate a move, and where the single largest pocket of hedging pressure sits. This guide walks through the grid, the colors, and the markers so you can read any ticker at a glance.

The Grid: Strikes × Expirations#
The heatmap is a table where rows = strike prices (highest at top) and columns = expiration dates (nearest on the left). Each cell shows the GEX value for that strike/expiry combination.
Colors: Blue vs Red#
Near-zero cells are light/white. The further from zero, the darker the color. Intensity is scaled relative to the overall grid with outlier protection — so a single extreme cell doesn't wash out the rest of the heatmap.
🏅 Top-5 GEX Nodes#
The heatmap automatically ranks the 5 cells with the largest absolute GEX values across the entire grid. Each is marked with a numbered badge — gold ① for the strongest, silver ② for second, bronze ③ for third, and muted ④ ⑤ for fourth and fifth.
- Blue #1 (positive) — Strong call wall. Tends to act as a major magnet above or at the spot price.
- Red #1 (negative) — Strong put wall. Dealer hedging at this level may amplify moves if breached.
- The sidebar shows the #1 Distance % for each ticker — how far the current spot price is from the top node.
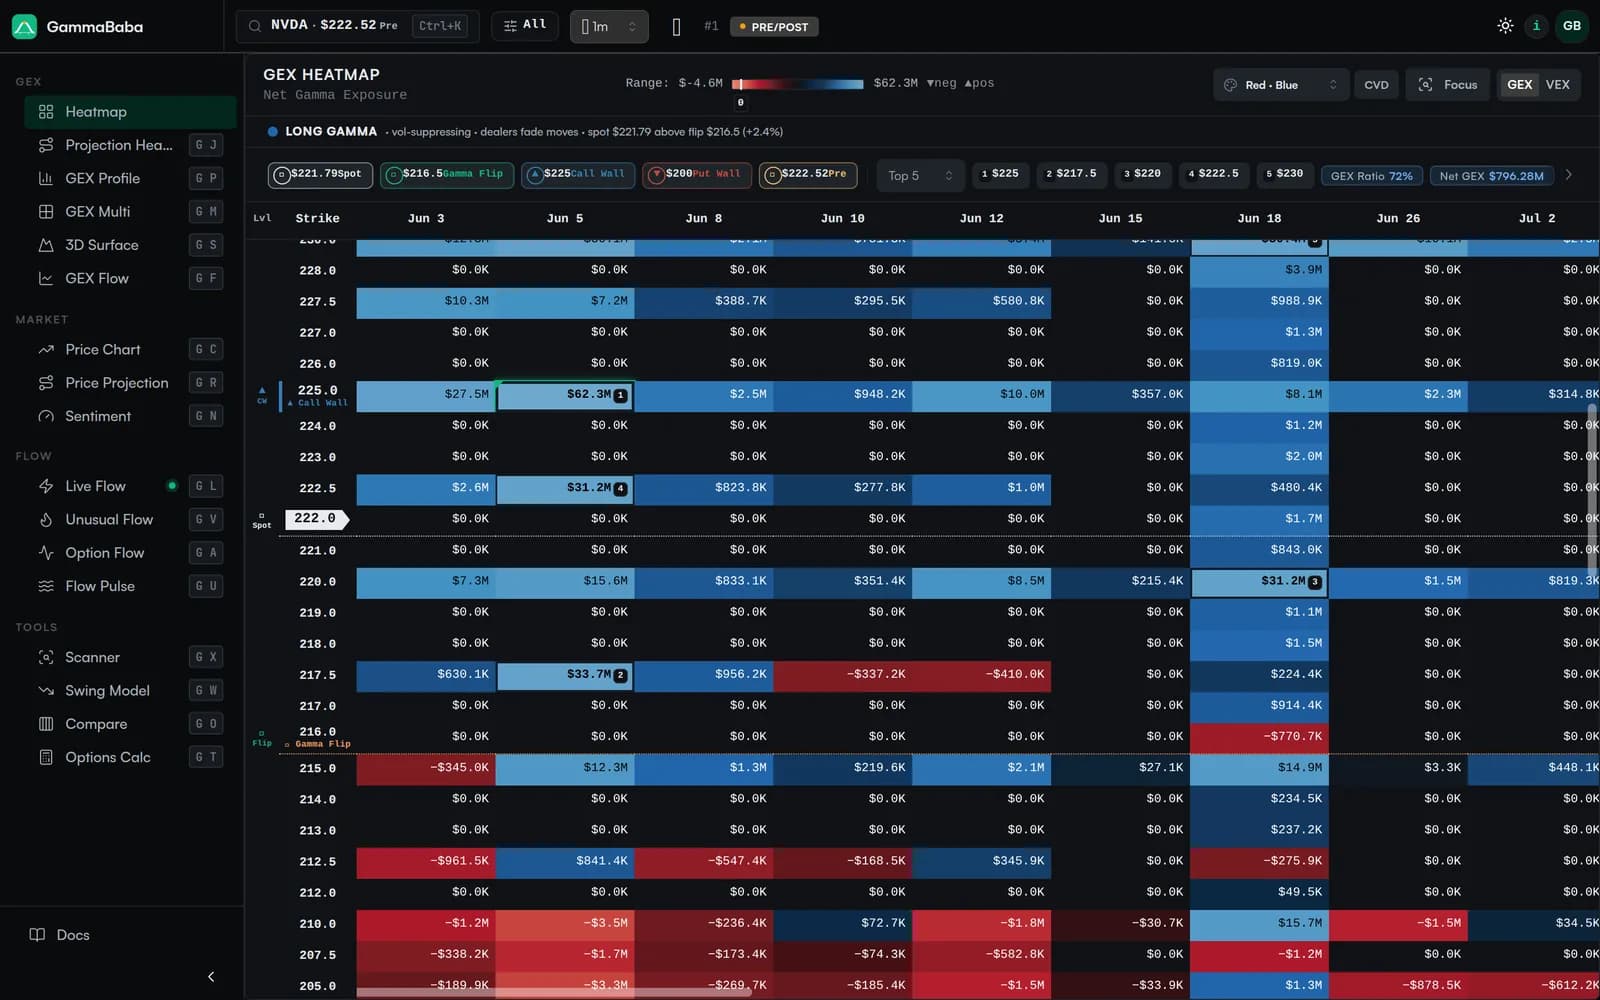
The same structure reads identically on any ticker. On NVDA below, the grid is denser and the walls cluster around different round-number strikes, but the method is the same: scan the colors for stabilizing and accelerating zones, then find the numbered badges to locate the strongest nodes.
The Current Price Row#
The row closest to the current spot price is highlighted with a subtle marker showing the exact price. This lets you instantly see the GEX landscape around where the stock is actually at.
Row Totals (Right Side)#
The rightmost area shows the total GEX per strike (sum across all expirations). This is useful for finding the overall strongest levels regardless of which specific expiry contributes the most gamma.
A strike with large total GEX across multiple expirations is a much more persistent level than one where GEX comes from a single expiry.
🔬 Fixed-Strike IV Badges#
Key strikes (current price, King Strike, Gamma Flip) display a small IV badge showing the OI-weighted Call IV and Put IV at that strike, plus a trend arrow showing if IV is rising or falling over the last 15–60 minutes (the freshest available window).
- C:45%▲ — Call IV at this strike is 45% and rising. Increasing demand for options at this level.
- P:52%▼ — Put IV at this strike is 52% and falling. Demand for puts at this level is declining.
These badges add observable market data to the GEX model. Learn more about this in the GEX Patterns page (Section 5: Fixed-Strike IV Change).
Clicking a Cell — Cell Drilldown#
Click any cell to open a detail view with:
- Net GEX of the cell with its concentration rank, distance from spot, and level tag (Call Wall / Put Wall / Flip / Spot)
- Cell GEX trend chart — intraday net GEX for this exact strike and expiry, with change chips over 5m, 15m, 30m, 1h, and 4h
- Fixed-strike IV chart — call and put IV held to this strike and this expiry, so a move means vol repricing rather than expiry-mix churn
- Strike context — where this strike sits in the full GEX-by-strike profile
- Live aggressor flow, volume/OI split, and individual call and put contract details (estimated greeks are marked "est")
Greeks Coverage#
Gamma values come directly from the options feed when reported. For contracts where gamma isn't published, a standard Black-Scholes estimate is used instead, so less-liquid strikes still contribute to the GEX picture instead of being silently dropped.
Estimated contracts are marked with a small 🧮 icon in the cell detail popup, so you can always see which values were reported vs. modeled.
GEX Scale: $1 vs 1%#
Two scaling options for the GEX calculation:
- $1 (per dollar move) — Standard GEX. How much hedging per $1 price change. Default.
- 1% (per 1% move) — Normalized GEX. Better for comparing tickers with different stock prices (e.g., SPY at $500 vs a $20 stock).