🧭 GEX Multi-Panel
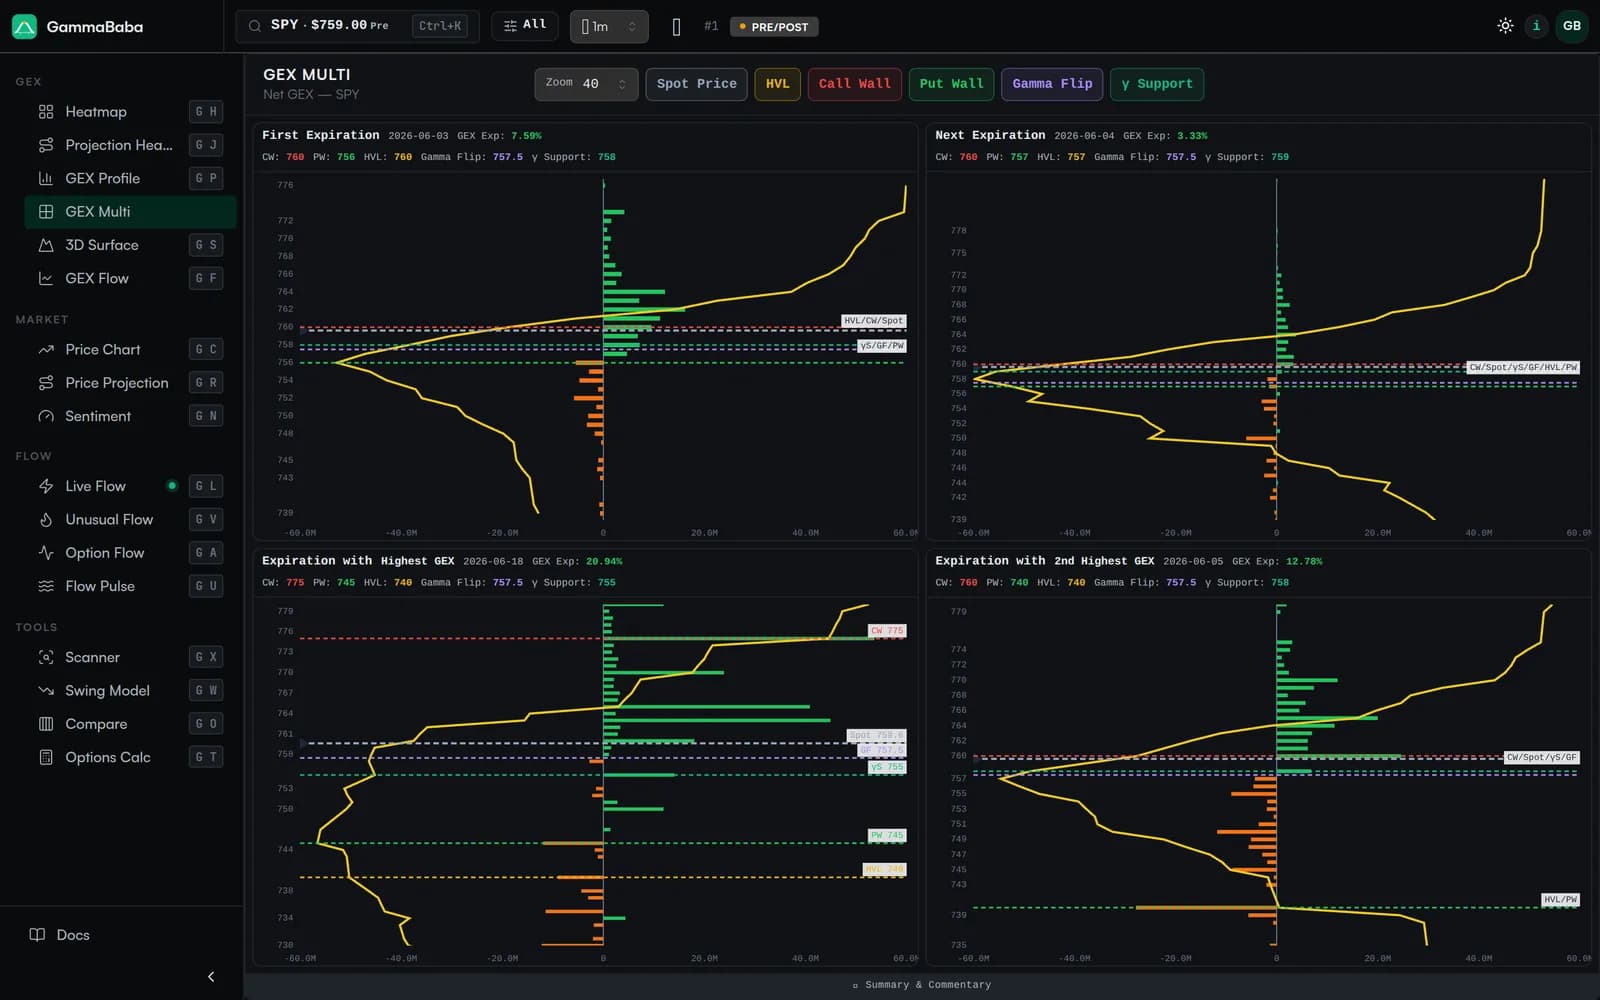
A combined heatmap blends every expiration into one picture. GEX Multi-Panel pulls them apart, giving you one GEX-by-strike profile per key expiration — the first expiry, the next one out, and the expiry carrying the most gamma — arranged side by side. The result is a fast read on the term structure of gamma: where short-dated, weekly and monthly positioning line up, and where a wall lives on only one expiry.
Why It’s Useful#
- 0DTE can dominate the combined heatmap. This view keeps it next to — not on top of — the monthly picture, so each expiry stays legible.
- Strikes that show up as walls in multiple panels are layered levels. Those tend to be more persistent than a single-expiry spike.
- It highlights where a wall is purely short-dated and will roll off after the next expiry, versus structure that survives into longer-dated positioning.
Reading the Grid#
- The nearest expiry is shown first, with the next expiration and the highest-gamma expiry following — so you compare the most relevant dates without scrolling a full chain.
- Each panel uses its own scale, so smaller expirations stay readable next to a heavyweight monthly.
- Hover any bar for the strike, GEX value and the call / put split at that strike.