⚡ Live Flow
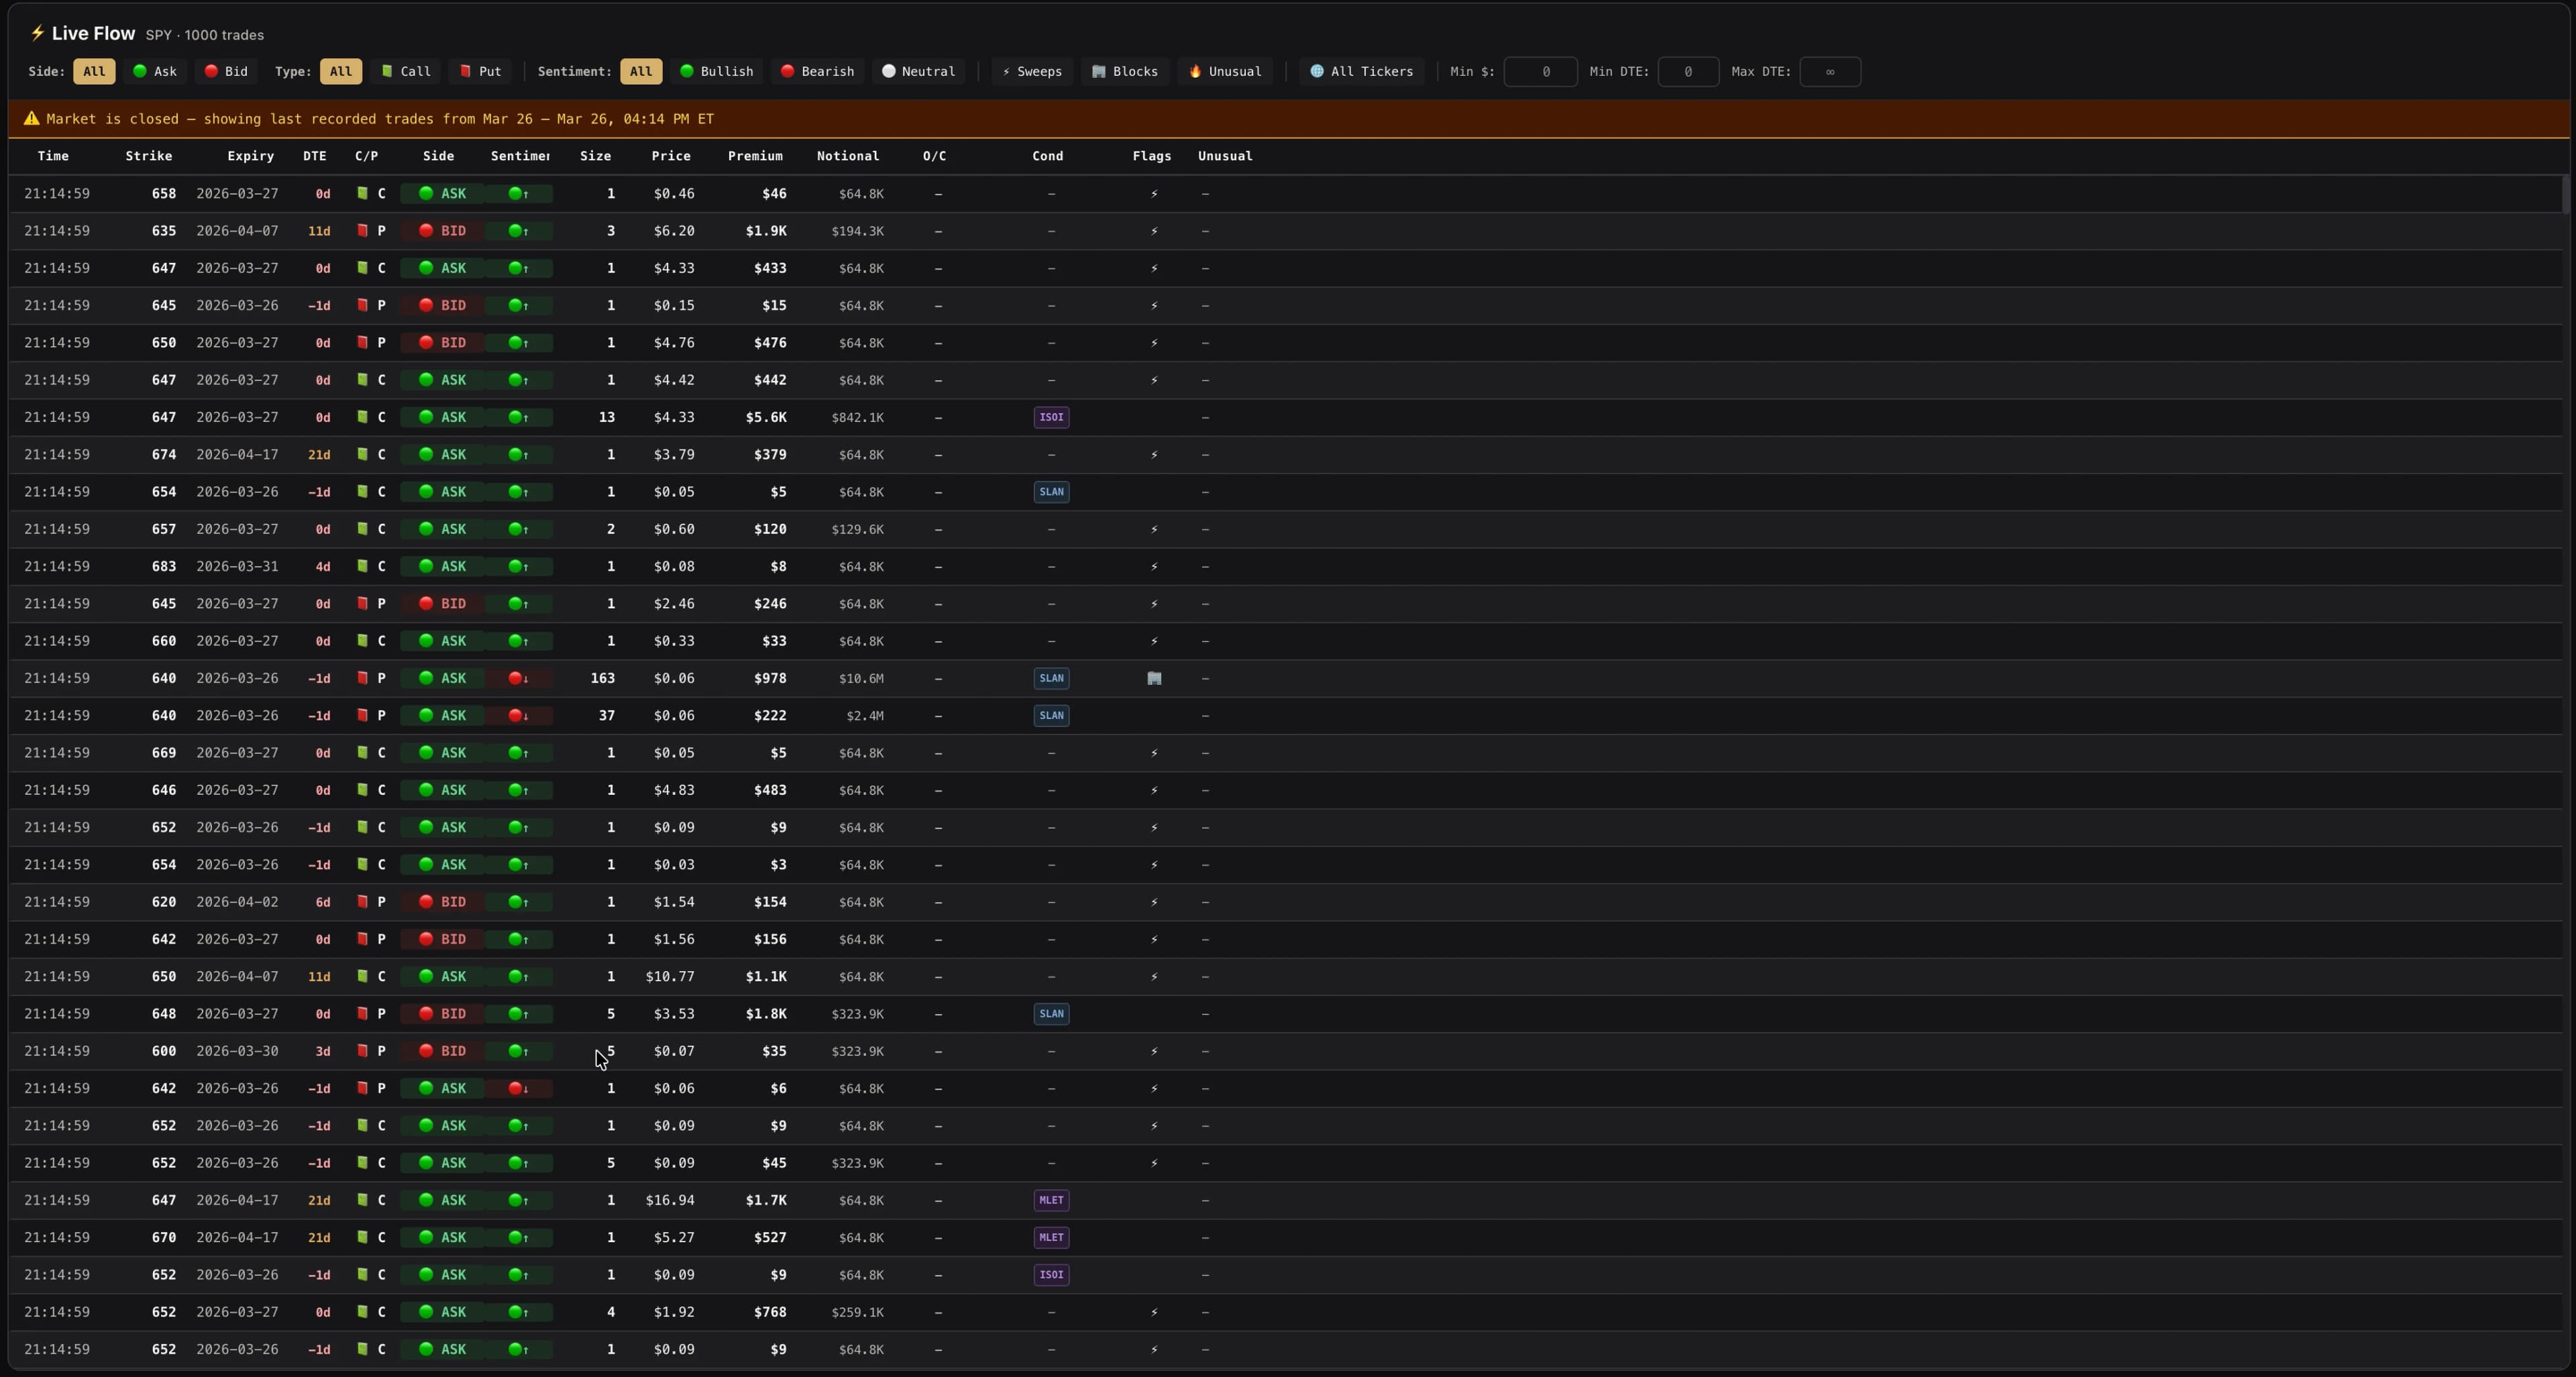
Live Flow is a real-time tape of options trades printing across the US options market. Watch large prints, sweeps, blocks, and unusual activity land as they happen — each trade annotated with premium, size, moneyness, an execution tag, and an estimated directional sentiment. Read the order flow at a glance, then filter it down to exactly what you care about.
What You See#
The Live Flow table displays individual options trades in a virtualized, high-performance scrolling list. Each row represents a single trade with detailed information across 16+ columns. The feed shows the last 2 hours of trades during market hours, and the most recent session when markets are closed.
Column Reference#
Every column in the Live Flow table:
Side & Sentiment Estimation#
The Side column estimates whether a trade was likely buyer-initiated or seller-initiated based on the trade's price relative to the bid/ask spread:
- 🟢 ASK / 🔥 AA — Trade executed at or above the ask price → likely a buy (someone aggressively lifted the offer)
- 🔴 BID / 💧 BB — Trade executed at or below the bid → likely a sell (someone hit the bid)
- ⚪ MID — Trade executed between bid and ask → direction uncertain
Sentiment combines the side with the contract type to estimate directional intent:
- Buying calls or selling puts → 🟢↑ Bullish
- Buying puts or selling calls → 🔴↓ Bearish
- Mid trades or ambiguous signals → ⚪ Neutral
Sweep & Block Detection#
The Type column identifies the execution method:
- SWEEP — An intermarket sweep order that hits multiple exchanges simultaneously. Often indicates urgency — the trader wants to fill a large order quickly across all available liquidity.
- BLOCK — A large single-exchange trade, typically negotiated off-market. Block trades often involve institutional participants.
- FLOOR — A trade executed on the exchange floor (not electronically). Less common in today's market.
- CROSS / AUCT / MULTI / ELEC — Various other execution types with different characteristics.
Unusual Activity Scoring#
Each trade receives an unusual score (0–100) based on multiple factors:
- Trade size relative to typical volume
- Premium amount (large dollar trades score higher)
- Execution type (sweeps and blocks score higher)
- Opening vs. closing trade (new positions score higher)
- DTE (very short-dated trades can score higher)
Scores are displayed as color-coded badges:
- ≥80 — Hot unusual activity (red badge)
- ≥60 — Notable unusual activity (amber badge)
- ≥40 — Mildly unusual (yellow badge)
- < 40 — Normal activity (no badge)
Reason badges next to the score show why the trade was flagged: SWEEP, BLOCK, OPEN, SIZE, PREM, and others.
Filters#
Live Flow includes a comprehensive filter system to narrow down the feed to the trades you care about:
- Side: All / Buy / Sell
- Type: All / Calls / Puts
- Sentiment: All / Bullish / Bearish / Neutral
- Sweeps only / Blocks only — Show only sweep or block executions
- Unusual only — Show only trades with unusual scores ≥40
- Ticker filter — Type one or more ticker symbols to filter
- Min/Max Premium — Dollar range filter
- Min/Max Size — Contract size range
- Min/Max DTE — Days to expiration range
- Min/Max Strike / Price / Notional / Score — Additional range filters
- Expiry filter — Filter to a specific expiration date
- O/C filter — Show only opening or closing trades
Sentiment Timeline#
Above the trade table, a sentiment timeline chart visualizes the aggregated bullish vs. bearish flow over time. This gives you a quick visual of whether the overall flow is leaning bullish or bearish across the current session.
Flow Summary Bar#
A summary bar at the top shows aggregate statistics for the current filter view:
- Total trades, total premium, and average trade size
- Call vs. Put volume breakdown
- Bullish vs. Bearish premium split
- Data source indicator (live or historical when markets are closed)