❓ Frequently Asked Questions
Short, practical answers to the questions traders ask most often about GammaBaba — what it visualizes, where its options data comes from, how the GEX heatmap refreshes, and which symbols it covers. For deeper dives see What is GEX?, Data & Methodology, and the Glossary.
What is GammaBaba?
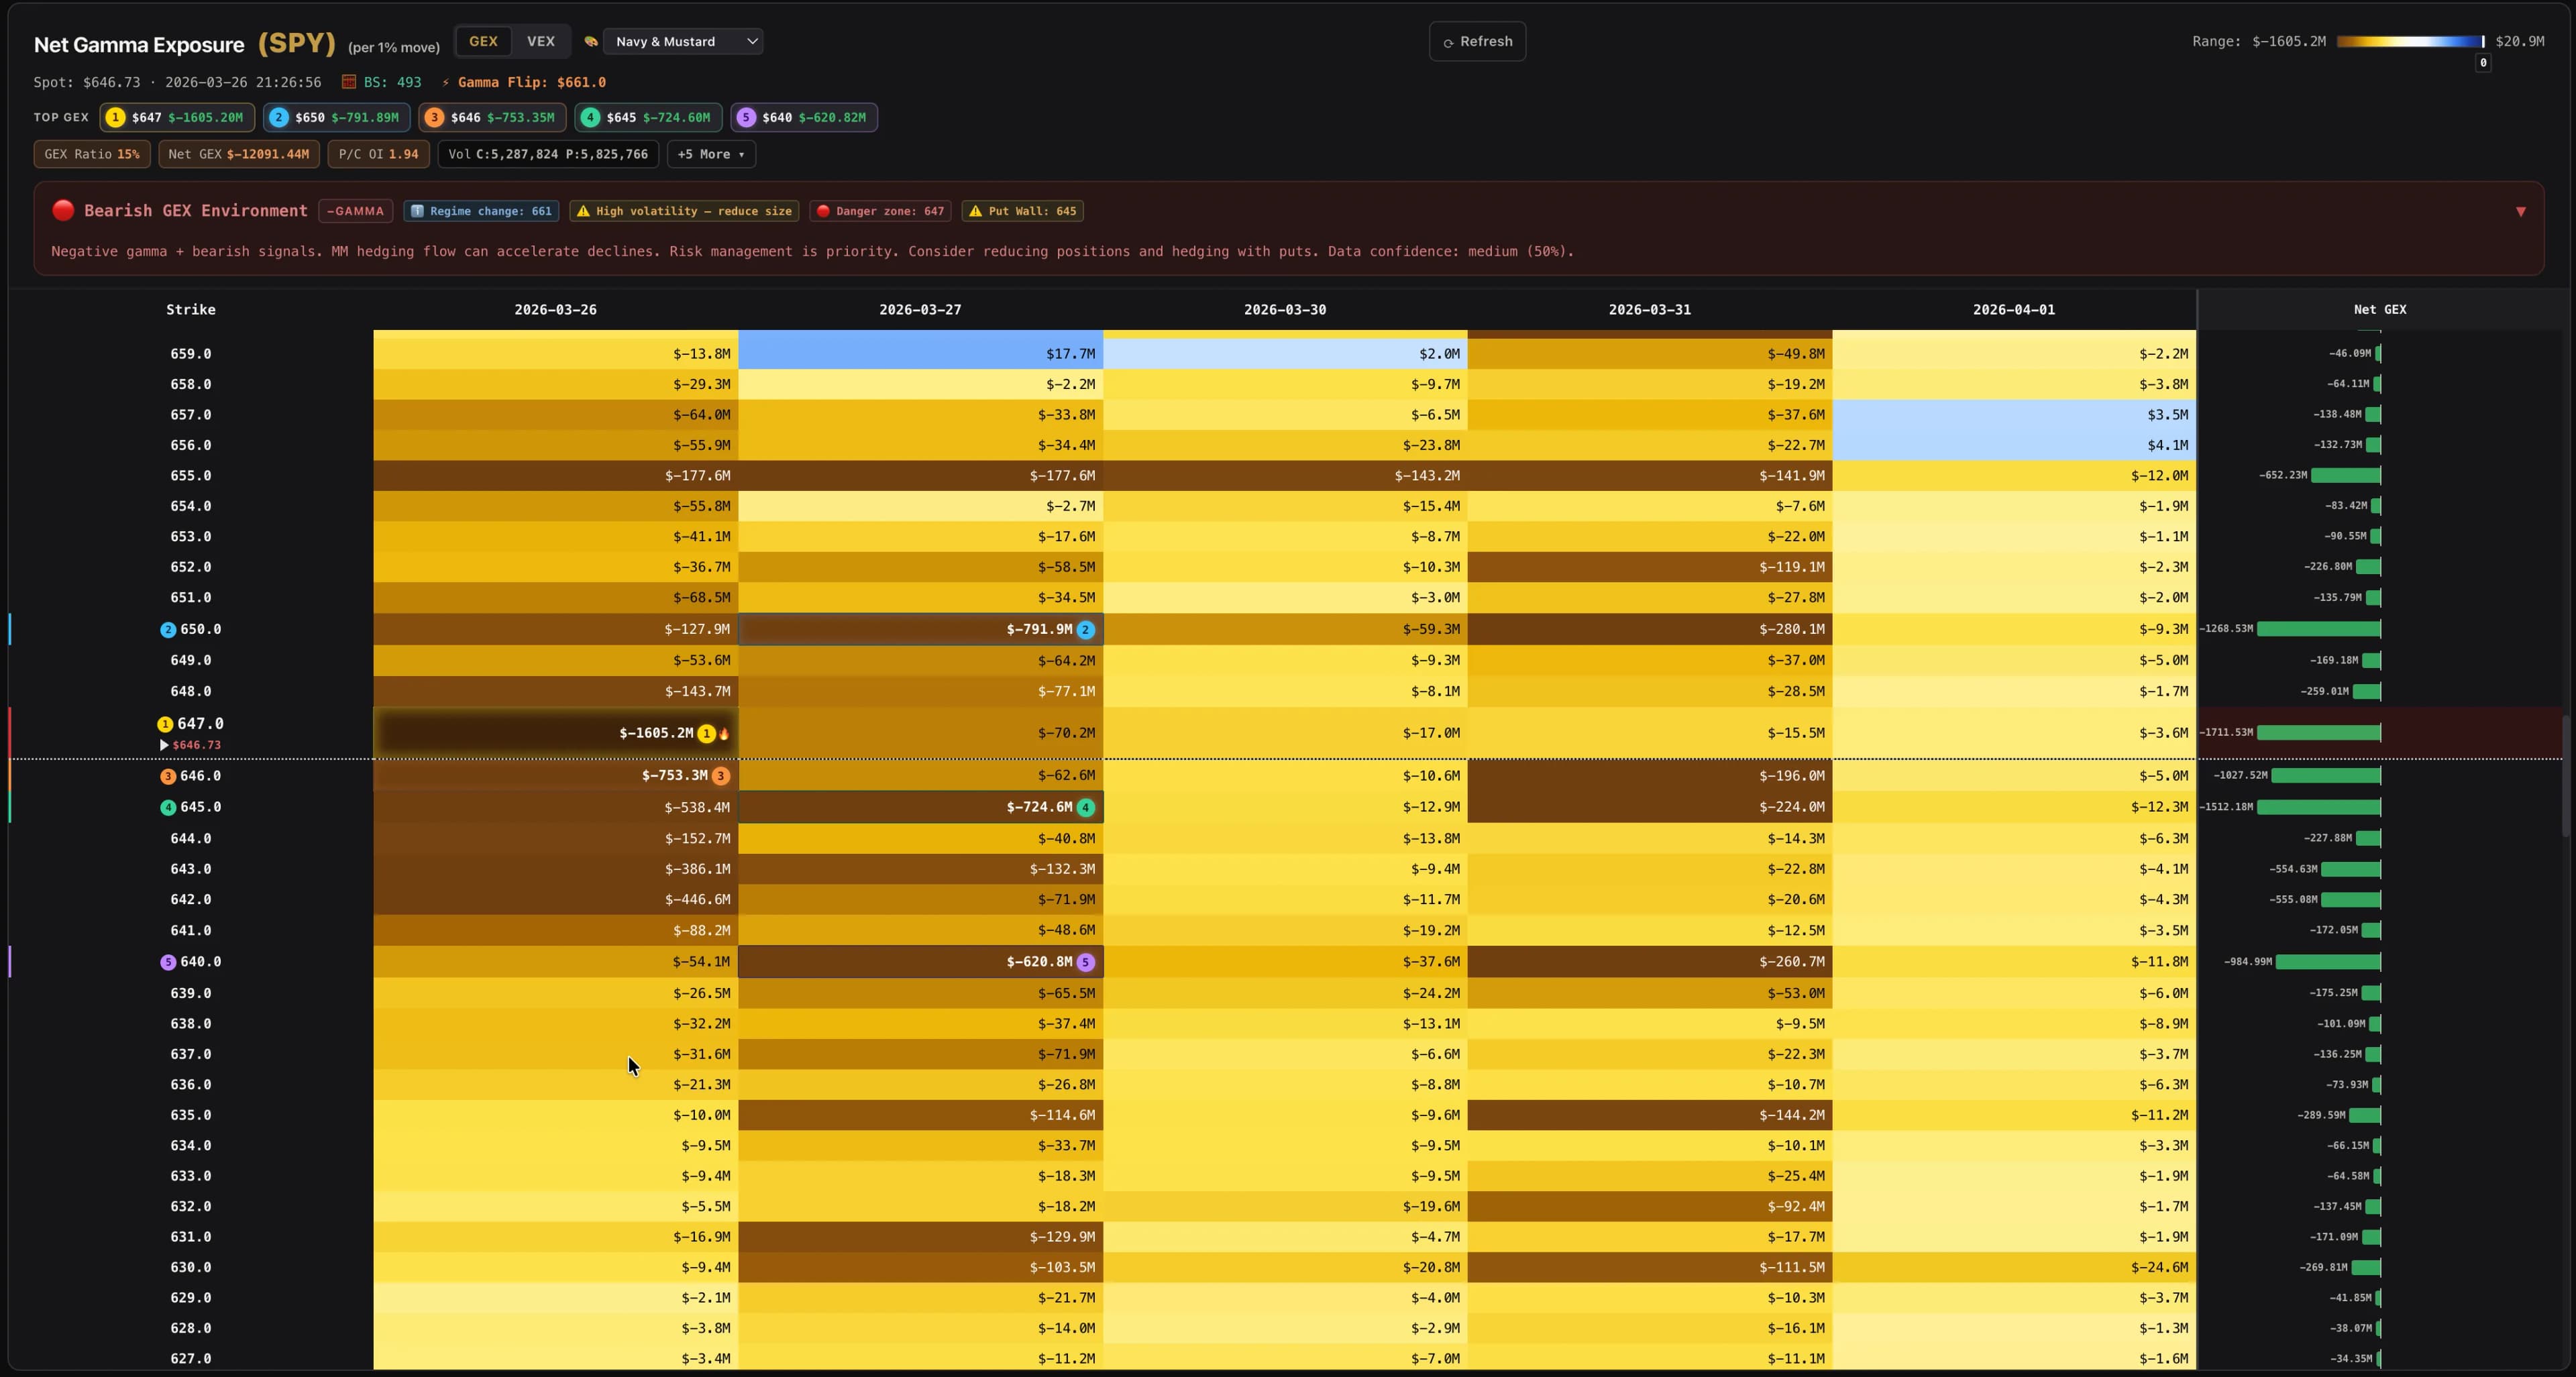
GammaBaba is a web-based options data visualization platform. It transforms US equity options data into interactive GEX heatmaps, candlestick charts with gamma overlays, live options-flow feeds, 3D volatility surfaces, and comparison dashboards. It is informational — not financial advice and not a brokerage.
Which tickers are supported?
Any optionable US stock or ETF — essentially the entire US options universe, including SPY, QQQ, AAPL, TSLA, NVDA, AMD, GOOGL, META, MSFT, IWM, DIA, GLD, TLT, and many more.
Where does the options data come from?
GammaBaba sources listed US options-chain data — strikes, expirations, open interest, and implied volatility — from established market data providers and derives gamma exposure from it. We surface the analytics; we are not an exchange or a brokerage.
Who is GammaBaba for?
It's built for active options traders, market-structure and flow-focused investors, and anyone studying how dealer gamma hedging can shape intraday price behavior. You should already be comfortable reading an options chain and understanding strikes, expirations, and open interest.
How often is the GEX data updated?
You choose the refresh interval: 1 minute, 5 minutes, 15 minutes, 1 hour, or 4 hours. Data reflects the most recent options-chain snapshot at that cadence during market hours.
What is the King Strike?
The King Strike is the single strike price with the highest total |GEX| on the board. It's often the most important level to watch because dealer hedging concentrates around it.
How do I read the heatmap colors?
Rows are strike prices, columns are expirations. Blue cells represent call walls (concentrated positive gamma from calls — price tends to be drawn toward them). Red cells represent put walls (concentrated negative gamma from puts — often act as support). See the Reading the Heatmap guide for the full breakdown.
Does GammaBaba execute trades?
No. GammaBaba has zero trade execution and zero brokerage connections. We do not provide trading signals or personalized financial advice. All data and visualizations are for informational and educational purposes only.
Do I need an account to use GammaBaba?
You can explore the core visualizations to get a feel for the platform. Some features — such as saving watchlists, comparison dashboards, and personalized settings — require an account so your preferences persist across sessions.
What does a gamma squeeze look like on the heatmap?
Rapid build-up of call-side gamma at strikes above spot, combined with price climbing through them, often indicates the setup. See the Gamma Squeeze Explained guide.
Why is my ticker missing data?
Low-volume or low-open-interest names may have sparse option chains. If a ticker has no listed options or no meaningful open interest, GEX can't be computed.
How is GEX calculated?
GEX estimates how much hedging pressure dealers face as the underlying moves — it combines each contract's gamma sensitivity with how much open interest sits at that strike, then weights calls and puts for typical dealer positioning. We compute it with our proprietary in-house gamma engine. See Data & Methodology for the concepts and assumptions.