💡 GEX Patterns & Concepts
Once you know where the gamma sits, the heatmap and GEX profile start telling a story. This page is a field guide to the structures that recur across most tickers — the gamma flip, the King Strike, call and put walls, expiration-day pinning — and what each one tends to imply for how price behaves around it. Every pattern below is visible directly in GammaBaba.

1. The King Strike Effect#
When the stock is near the King Strike and overall GEX is positive, a pinning effect is commonly observed. Dealers continuously buy dips and sell rips, creating hedging pressure that tends to pull price toward that strike.
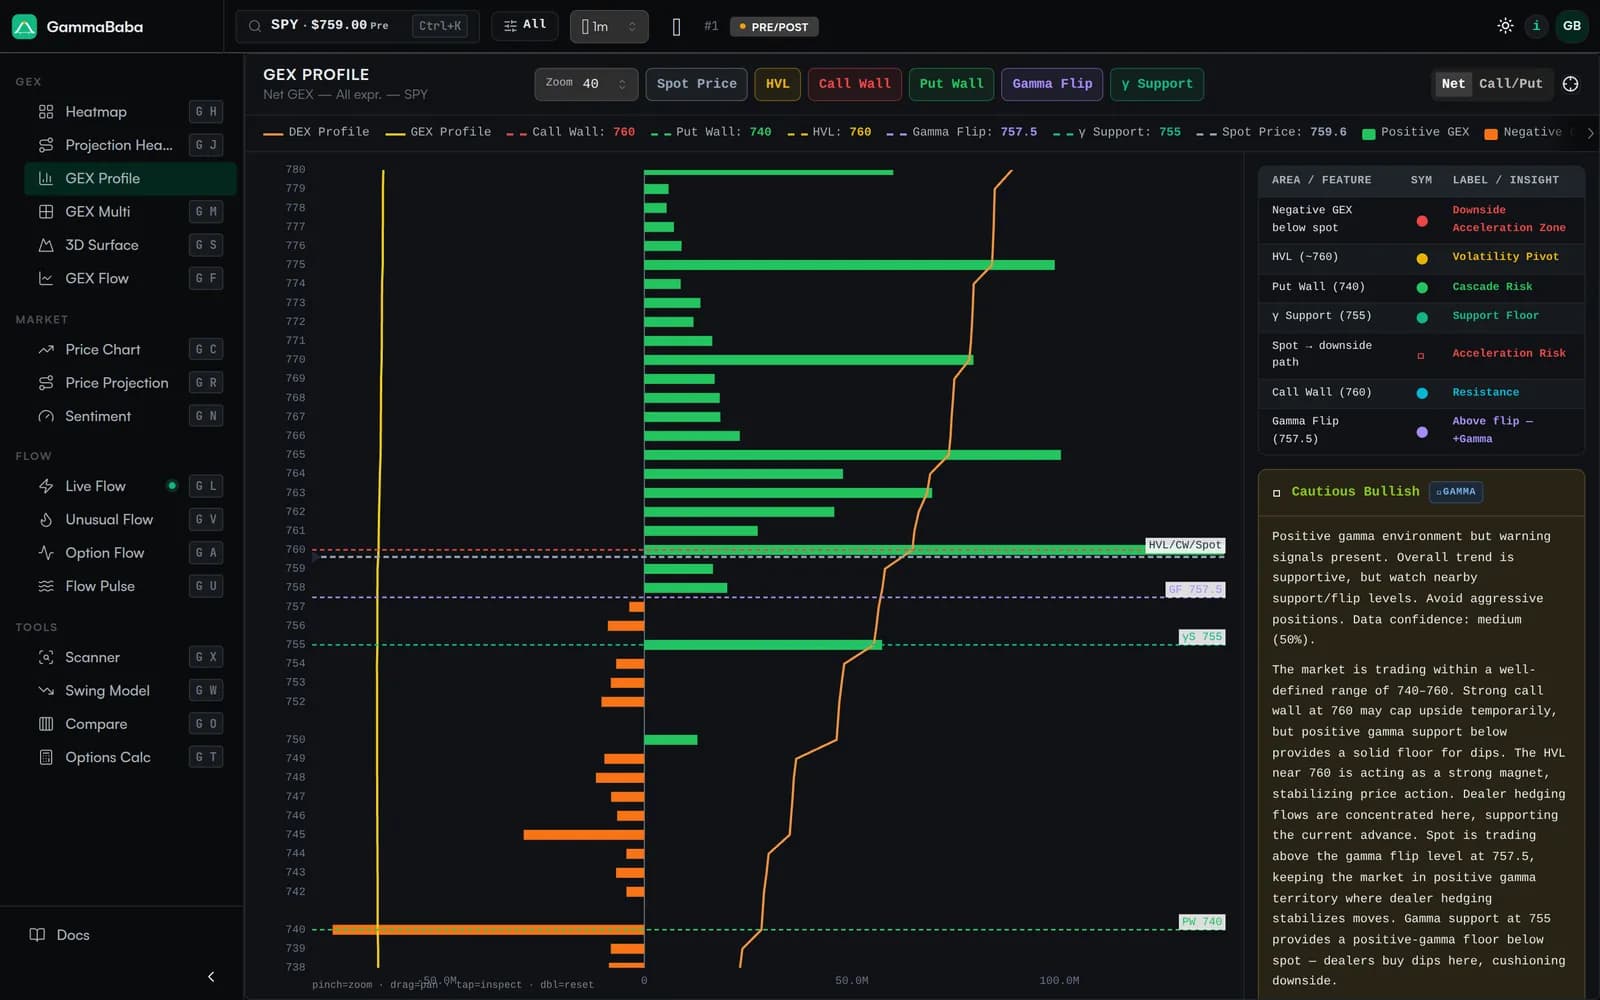
2. The Gamma Flip Level#
The Gamma Flip is the price level where net GEX flips from positive to negative. Below the flip, dealers' hedging tends to amplify moves; above it, hedging tends to dampen moves.
- Above Gamma Flip → Positive GEX environment. Dealer hedging tends to dampen volatility, often favoring range-bound behavior.
- Below Gamma Flip → Negative GEX environment. Dealer hedging tends to amplify moves, often resulting in sharper price action.
3. Expiration Day Dynamics (OpEx)#
As options approach expiration, their gamma increases dramatically (especially for ATM options). This means the leftmost column in the heatmap has the most hedging impact.
- 0DTE / same-week expiry — Extremely high gamma. Price tends to cluster around high-OI strikes intraday.
- After expiration — Those contracts vanish. The GEX landscape can shift dramatically overnight. Always recheck the heatmap after every OpEx.
- Monthly OpEx (3rd Friday) — The largest gamma unwind of the month. Increased volatility is often observed the following Monday as the GEX landscape resets.
4. Dashboard Metrics#
The summary bar at the top of the heatmap shows six key metrics for an instant snapshot of the overall options landscape:
- GEX Ratio — Balance between call and put gamma. Above 50% = calls dominate (stabilizing). Below 50% = puts dominate (amplifying).
- Net GEX — Total gamma exposure in dollar terms. Positive = dampening, negative = amplifying.
- IV Ratio — Are calls or puts relatively more expensive? Based on OI-weighted implied volatility. For index ETFs, sub-50% is normal due to structural put skew.
- Net IV — Absolute IV difference between calls and puts. Positive = calls more expensive; negative = puts more expensive.
- P/C OI — Put/Call open interest ratio. Above 1.0 = more puts than calls.
- Volume — Day volume for calls and puts, showing current session activity level.
5. Fixed-Strike IV Change#
GEX tells you where dealer hedging pressure should exist based on open interest. Fixed-strike IV change tells you whether the market is actively repricing risk at that level — the same strike and the same expiry compared against earlier snapshots, so spot drift and expiry roll-off can’t fake the signal.
- GEX level + IV falling at that strike → No fresh demand for options there. The level is holding without a fight.
- GEX level + IV rising at that strike → Active demand for options at that level. Positioning may be building against the GEX read.
IV badges on key strikes (King, Flip, Current Price) show real-time call/put IV with trend arrows (▲/▼). Click any cell for the intraday fixed-strike IV chart and change chips over 5m, 15m, 30m, 1h, and 4h.
6. Dark Cells = Key Levels#
The darkest cells on the heatmap represent the highest GEX concentration:
- Dark blue row → Major call wall. Dealers' hedging at this level tends to resist price moves through it.
- Dark red row → Major put wall. If price reaches this level, dealer hedging may accelerate the move.
- Cluster of dark cells at one strike → Multiple expirations aligned at the same strike = a very persistent level with layered hedging pressure.
7. Intraday GEX Shifts#
GEX isn't static — it changes throughout the day as options are traded, prices move, and OI shifts. GammaBaba auto-refreshes to capture these changes.
- Click any cell → See how the GEX value changed over 1m, 5m, 15m, 1h, and 4h.
- A cell that was light but is now getting darker means new positioning is building at that level.
- A King Strike that shifts during the day indicates large new positions being opened, shifting the center of dealer hedging.
8. Common Patterns — Cheat Sheet#
| Pattern | What It Reflects | Typical Characteristic |
|---|---|---|
| Price at Blue King | Max hedging pressure zone | 🧲 Lower vol, tight range, mean-reversion tendency |
| Price below Gamma Flip | Negative GEX territory | 🔥 Trend continuation tendency, higher vol |
| King Strike shifts up | New call OI building higher | 📈 Upward repositioning observed |
| King Strike shifts down | New put OI building lower | 📉 Downward repositioning observed |
| All columns dark at one strike | Multi-expiry convergence | 🧱 Very persistent GEX wall with layered hedging |
| 0DTE column dominates | Same-day gamma is very high | 📌 Intraday pinning tendency, resets after close |
| Large red below spot | Big put wall beneath price | 💨 Dealer hedging may accelerate decline if breached |
| GEX decreasing overall | Fewer dealer hedging obligations | ⚡ Higher realized vol environment likely |
| Call wall + call IV crushing ▼ | No breakout demand at resistance | ✅ GEX level and vol data aligned |
| Call wall + call IV elevated ▲ | Upside demand despite GEX ceiling | ⚠️ Vol data diverges from GEX — worth monitoring |
| Put wall + put IV falling ▼ | Hedging demand fading at support | ⚠️ Wall may be weakening — vol demand declining |
9. What GEX Cannot Tell You#
GEX is a useful analytical lens, but it has clear limitations:
- Direction — GEX shows where hedging pressure exists, not which direction the stock will move.
- Timing — A strong GEX level may hold for hours or be broken in minutes by a catalyst (earnings, news, macro events).
- Hidden positions — OTC options, exotic structures, and dark pool activity don't appear in GEX data.
- Post-market changes — After-hours trading can move price beyond GEX levels before the next session.
- Dealer positioning assumption — GEX assumes a specific model of who is long and short gamma. Use fixed-strike IV to check whether observable market behavior aligns with the model.