🧮 Options Calculator
The Options Calculator turns a live option chain into a strategy lab. Start from a preset such as an iron condor, vertical spread, straddle or covered call — or assemble a custom position one leg at a time — then read the payoff at a glance: breakevens, max profit and max loss, probability of profit, net premium and the position Greeks all update as you adjust strikes, quantities and expiry. It is built for the moment before you place a trade, when you want to see exactly what you are taking on.
Build a Position#
- Symbol & expiry — use the current app ticker and switch the active expiry without leaving the page; the latest chain loads behind the scenes.
- Strategy library — start from common structures: vertical spreads (debit and credit), iron condors, straddles, strangles, calendars, covered calls and protective puts.
- Leg builder — add, edit, buy or sell, resize or remove legs; stock legs are supported alongside calls and puts so covered and hedged positions model correctly.
- Live chain pricing — each leg is priced from the selected chain, so the calculator reflects current strikes and premiums rather than a static example.
Read the Payoff#
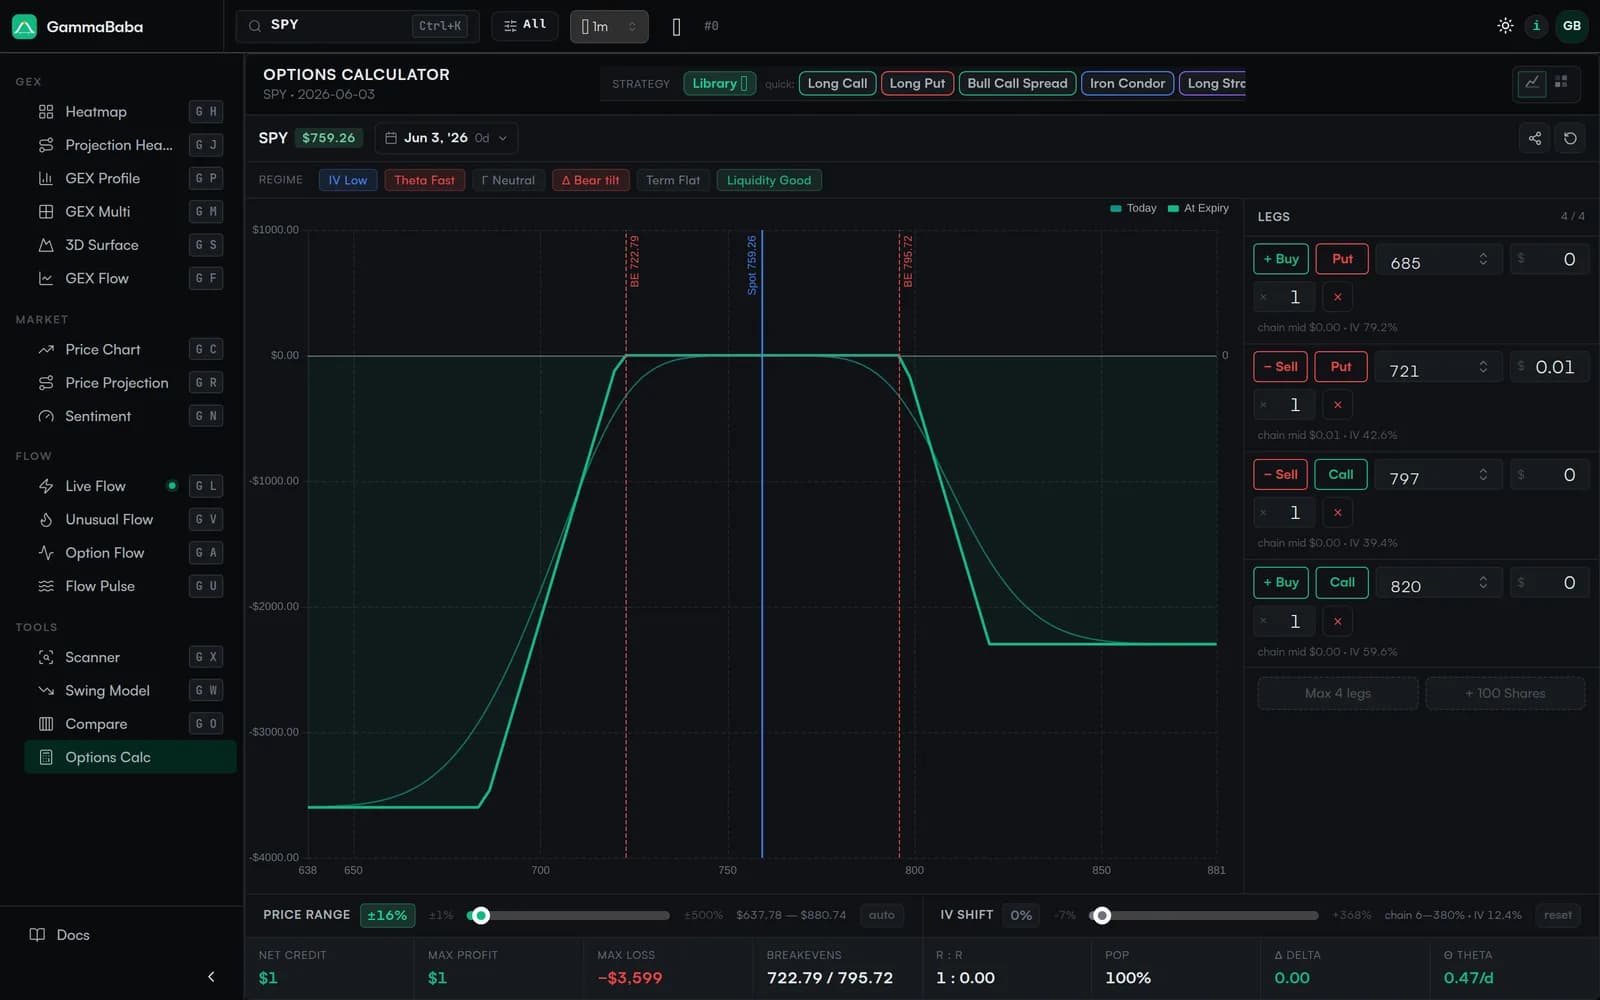
- Payoff chart — shows the expiration payoff and scenario P/L across the selected price range, with breakevens marked on the curve.
- Key metrics — net premium (debit or credit), max profit, max loss, breakevens and probability of profit are summarized in one bar.
- Position Greeks — net delta, gamma, theta and vega aggregate across every leg so you can see directional, decay and volatility exposure at the position level.
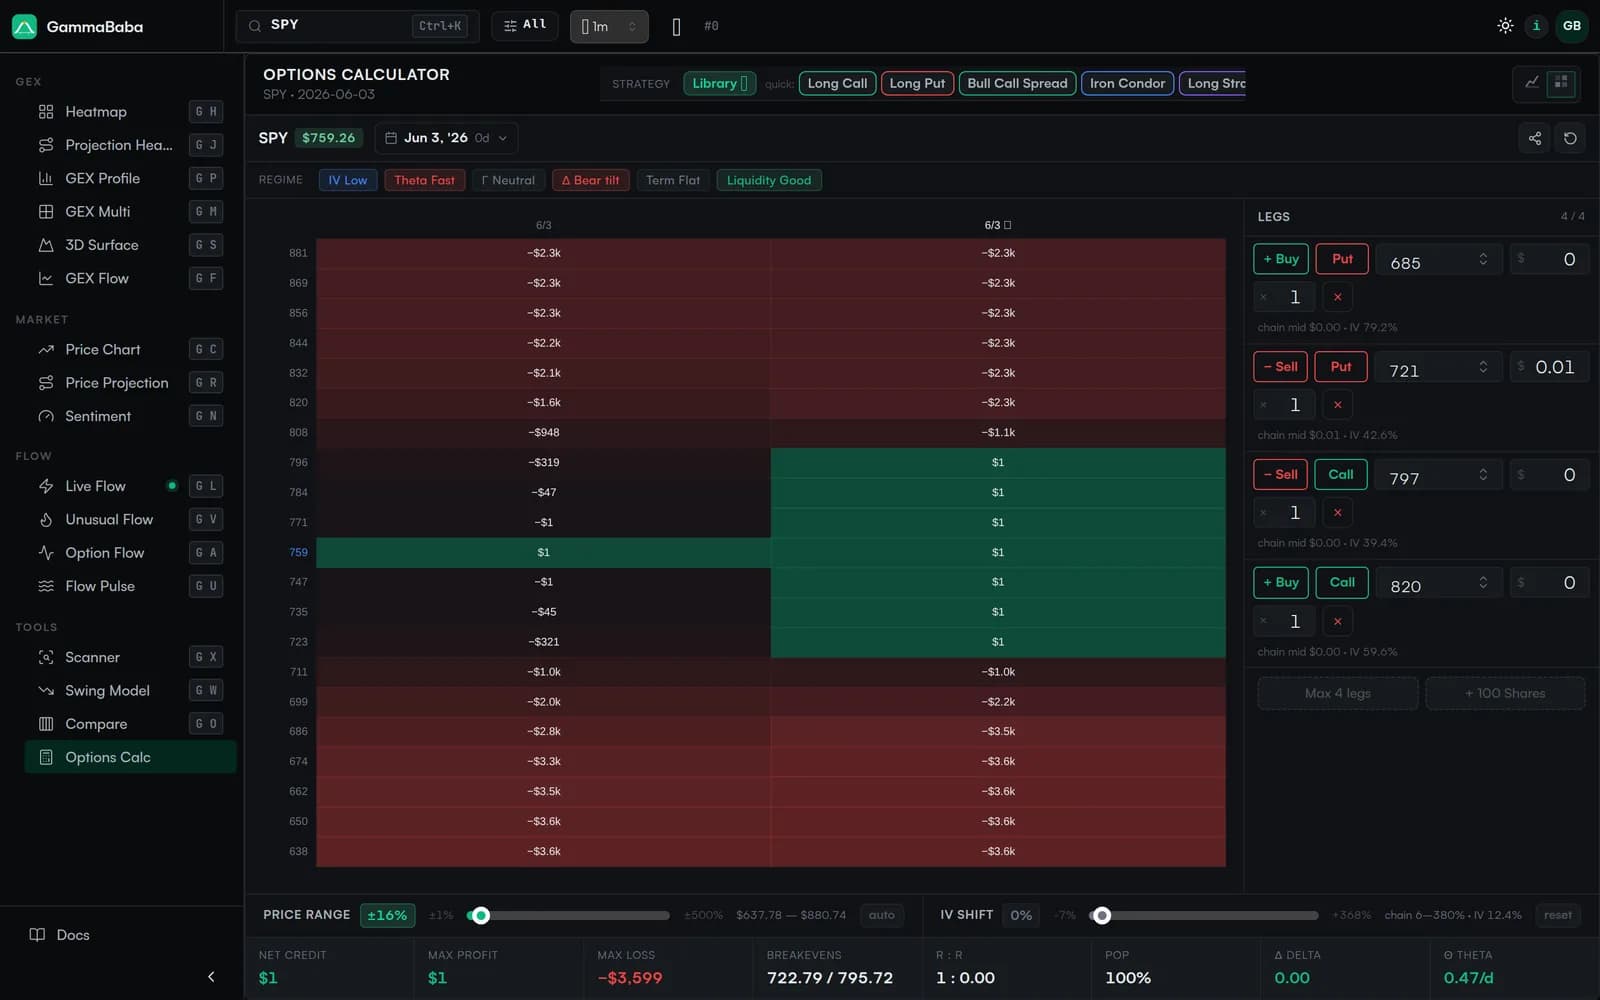
- P/L heatmap — scans price against date so time decay and convexity are visible at a glance, not just at expiration.
Stress-Test Assumptions#
A payoff at a single set of assumptions only tells part of the story. Use the scenario controls to shift implied volatility up or down and to widen or narrow the price range, then watch how breakevens, probability of profit and the Greeks respond. This makes it easy to see, for example, how a credit spread holds up if volatility spikes, or where a calendar starts to lose its edge.
Market Context#
A context panel derives a short regime read from the same chain: at-the-money IV, term structure, put/call open interest, the gamma flip and liquidity. Treat it as a sanity check on the environment around your strategy rather than a signal to enter a trade on its own.
Date × Price View#
The at-expiry payoff line answers one question well: where do I stand if I hold to expiration? But most positions are closed before then, and a single line cannot show how time decay and a price move interact along the way. Switch the payoff into the Date × Price view and the calculator lays the position out as a heatmap — a grid of profit and loss with a range of dates across the columns and underlying prices down the rows.
Each cell is color-coded from red (loss) through to green (profit), so you can trace how the P/L evolves as the days roll forward and the underlying drifts. It makes the combined effect of theta and a directional move legible at a glance: you can see where a credit spread quietly accrues its premium, or how quickly a long option bleeds if the move you expected is late to arrive.
Strategy Library#
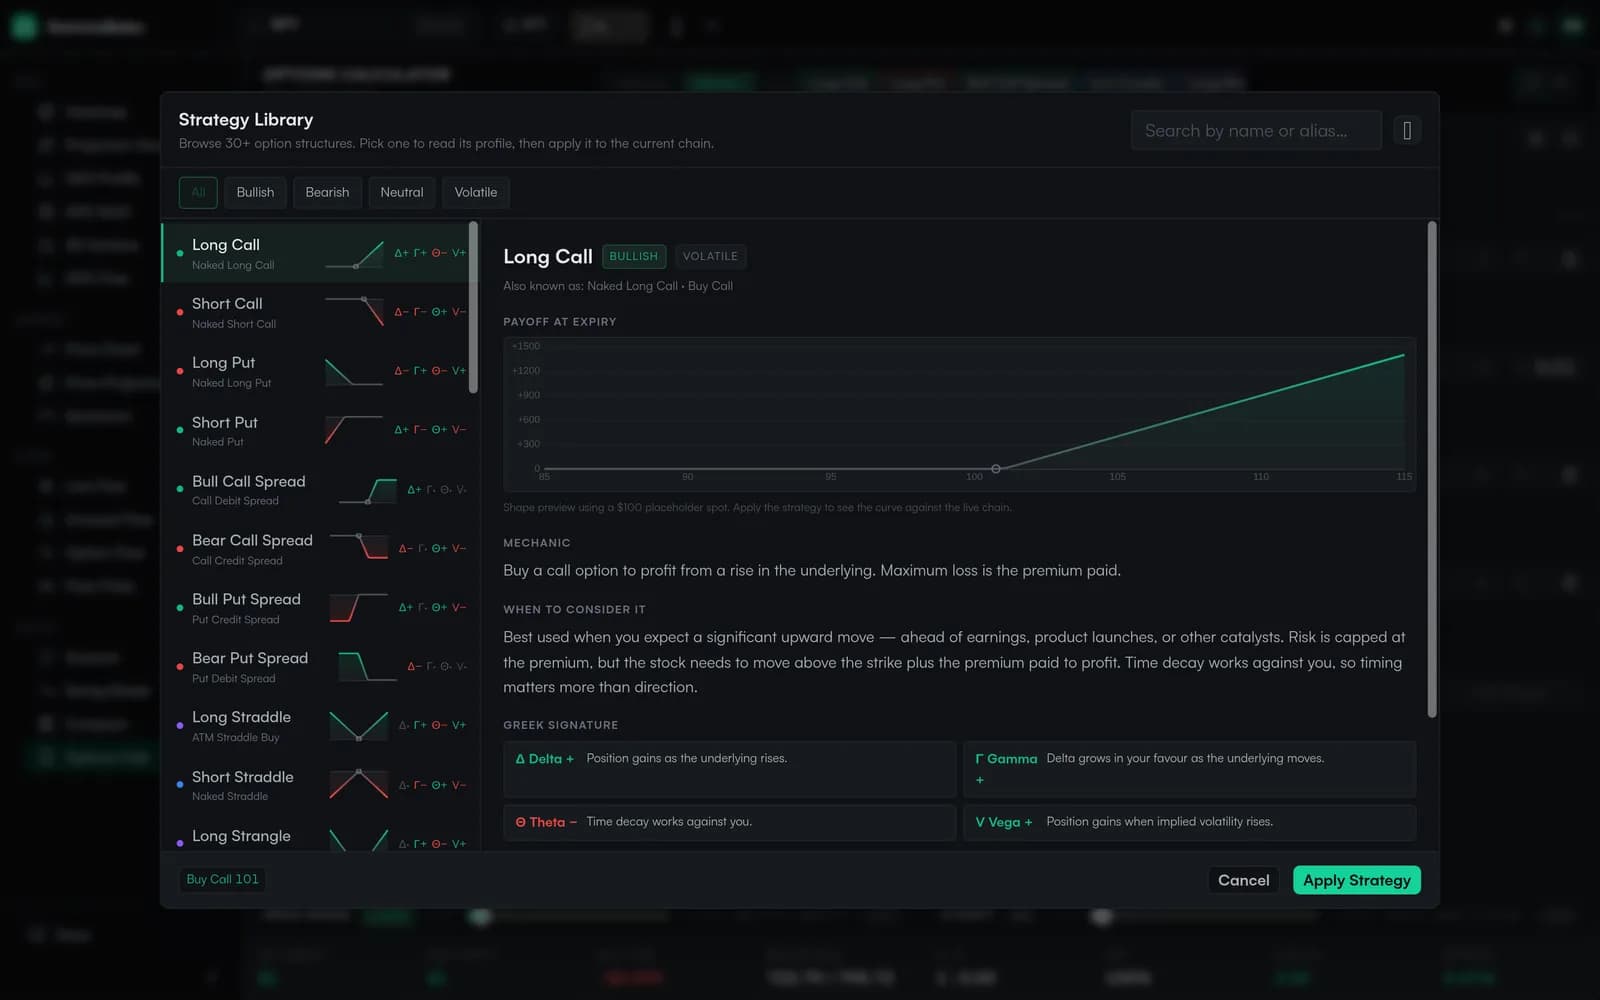
You do not have to assemble every position by hand. A built-in library collects common option structures — long calls and puts, debit and credit vertical spreads, straddles, strangles, iron condors, covered calls and more — organized by the market view they express: Bullish, Bearish, Neutral and Volatile. Start from the outlook you already have and narrow to the structures that fit it.
Every entry comes with a mini payoff preview so the shape of the trade is obvious before you commit, a plain-English note on when to consider it, and the Greek signature — delta, gamma, theta and vega — so you know its directional, decay and volatility character up front. Applying one drops its legs onto the current chain at mid prices, leaving you a working starting point to tweak from there rather than a blank canvas.